- Solutions
- Products
- Resources
- Company
 Investor Relations
Financial Information
- Careers
Insights & Updates from
Ceva’s Technology Blog


Turnkey Embedded Communications Systems for IoT Connectivity

FiRa 3.0 Use Cases: Expanding the Future of UWB Technology

An Insider’s Look At CES’s Emerging Tech Trends For 2025

HDT Bluetooth: the Next Step in High Quality Audio Streaming

How The Smart Edge Drives Demand For Efficient Chip Design Strategies

Bluetooth LE and UWB Extend Automotive Features Efficiently

Hearables Featuring AI are Gaining Traction

Beyond 5G expect ISAC for Radar Positioning and More

The AIPC is Reinventing PC Hardware

Surveillance Cameras and CV Conditioning

NPU IP Design Driven by Software Insights and Use Cases

Open Standard Clarifies the Role of UWB vs Bluetooth

Challenges in Designing Automotive Radar Systems

Futureproofing Automotive AI to Manage Lifetime Cost

Ambient IoT will Supercharge Asset Tracking

ORB Feature Detection Boosts Visual SLAM Performance

LE Audio and Auracast Aim to Personalize the Audio Experience

Evaluating Spatial Audio – Part 1 – Criteria & Challenges

Living on the Smart Edge: reflecting on a great year at Ceva

BLE Set to Dominate Indoor Positioning Systems

5G Based LEO satellites will Truly Grow IoT Adoption Worldwide

Wi-Fi 7 vs 6/6E: MLO & Design Considerations for Engineers

Efficiently Packing Neural Network AI Model for the Edge

AI Audio for Voice Enhancement: Deep into the Deep – Part 3

BLE Supercharges Electronic Shelf Labels for Retail

Transformer Networks Optimized for ChatGPT Mobile

Gyro Pen Revolution: From Passive Stylus to Motion Pen

Transformer Models and NPU IP Co-Optimized for the Edge

Automotive Battery Management System Using Bluetooth LE
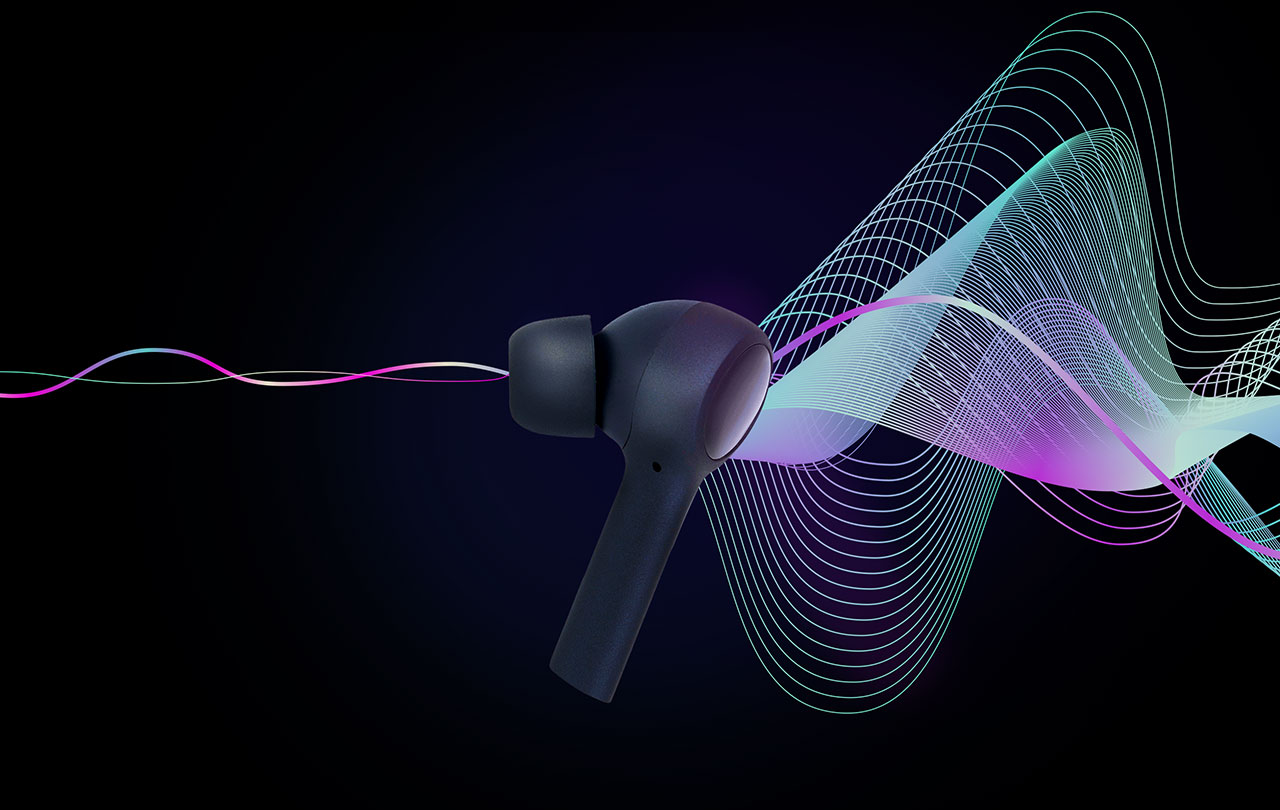


What is Spatial Audio and What Does it Have To Do With Binaural Audio?

A Confident ASIC Design Path through Co-Creation

The Stars Finally Aligning for Satellite IoT Devices

Personalize This! – The Personalized User Experience

Voice Control for Low Power Edge Devices

Robot Dead Reckoning: A Deep Dive into Odometry Testing and Analysis

CEVA’s SystemC Simulator, A SoC Simulator Par None

PentaG-RAN Baseband IP Platform Delivers Massive MIMO for Open RAN

Automotive Architectures Push ADAS System Architectures

CEVA & CERN: Where Edge AI and Particle Physics Intersect

Pedestrian Dead Reckoning Enhances Location-Based Services

I had a dream: Auracast made it come true.

Human Presence Detection and You

IoT, DSP and RTOS – A Perfect Match

Untethering Smartwatches

How to Evaluate a 3D Audio Solution
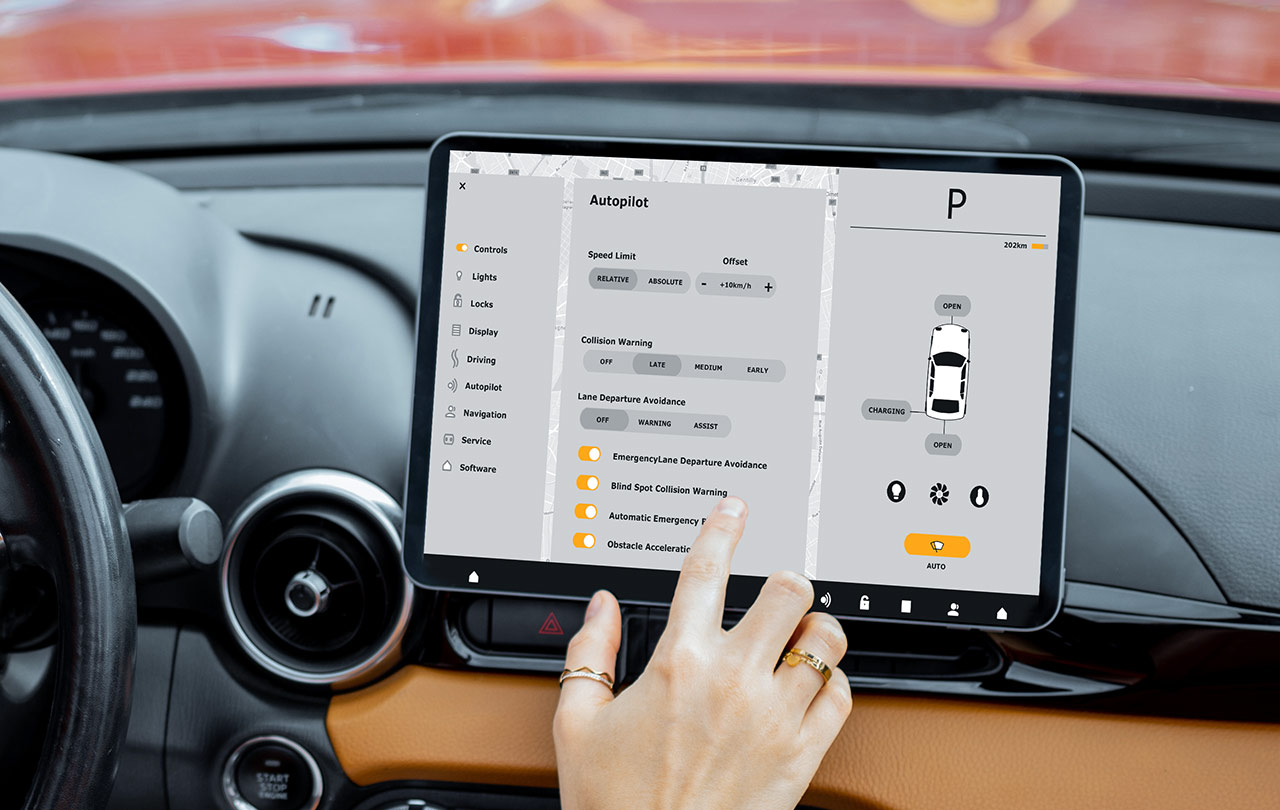
Meeting the challenges of edge AI

How RedCap fits into 5G and IoT
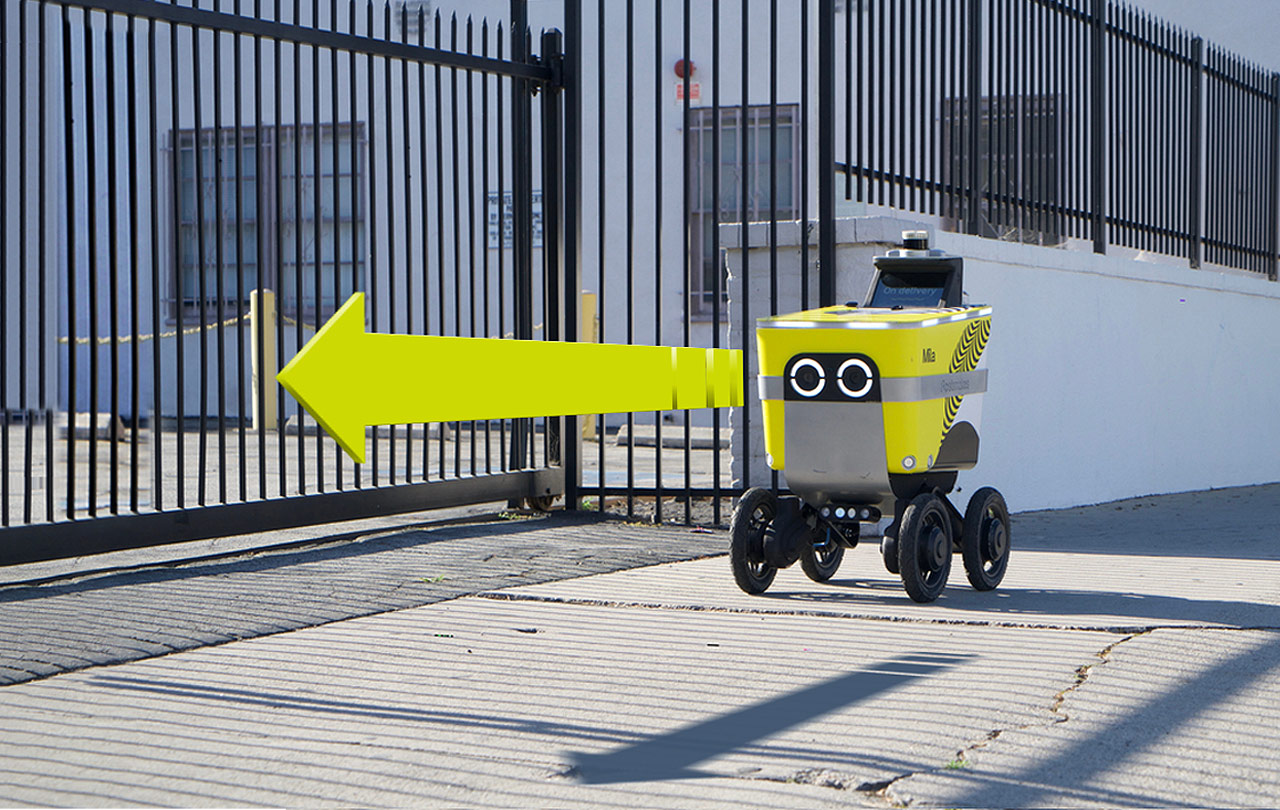
Dead Reckoning Shows the Way for Robots (Part 4)

Delivering on the 5G Promise for IoT
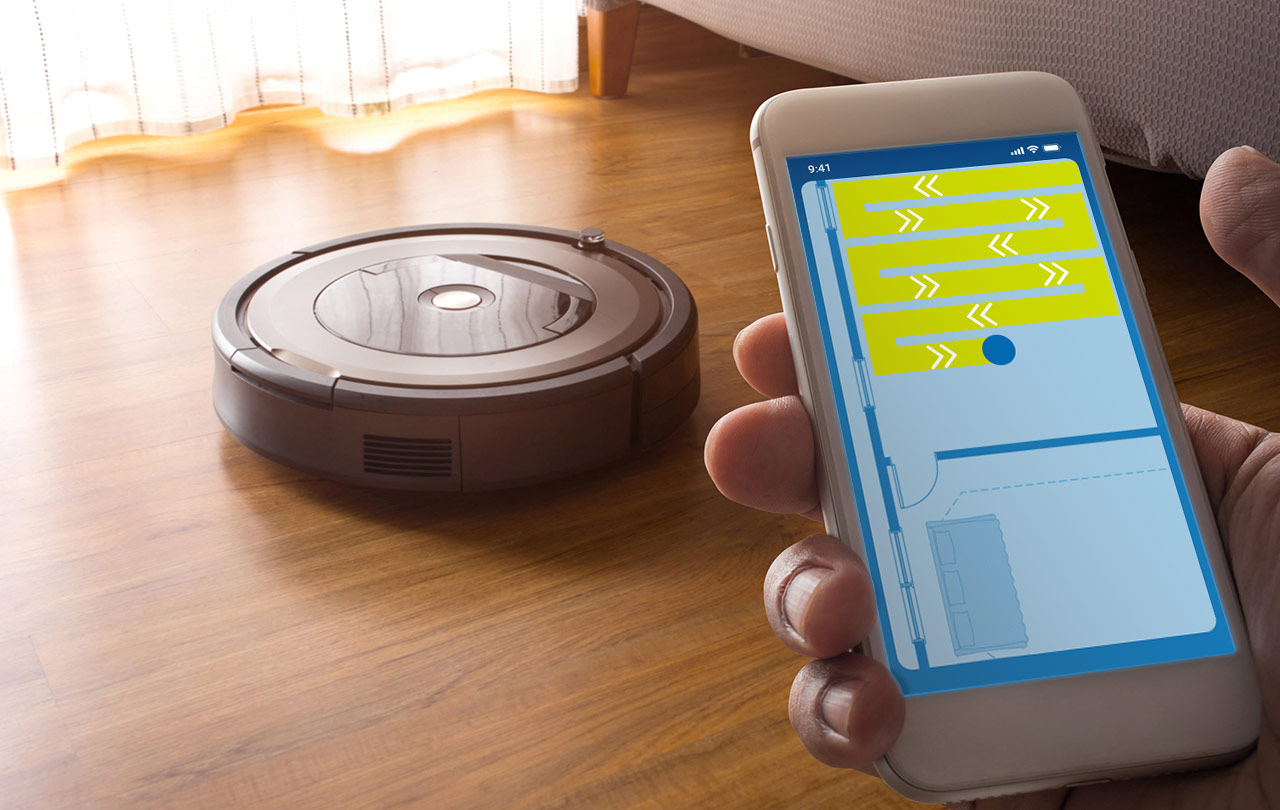
Robot Navigation Part 3: How to Analyze Navigation Accuracy

Buckle Up for More Mandated Driver Assistance

Specifying and Qualifying Sensors for Robot Navigation (Part 2)

AI at the Edge – Raise Your Expectations

Rising Importance of Location in a Mobile World
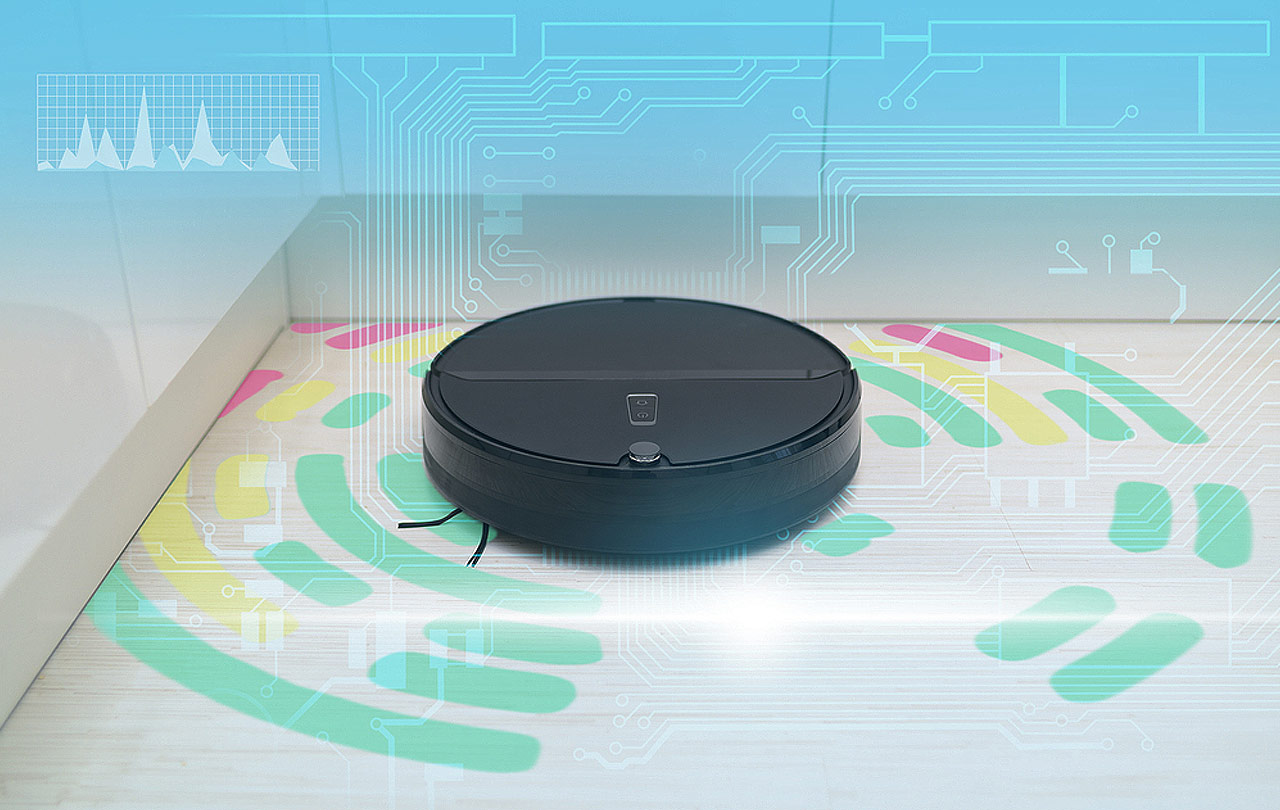
How Sensor Fusion Enables Effective Robot Navigation (Part 1)

CEVA – We’re in it.
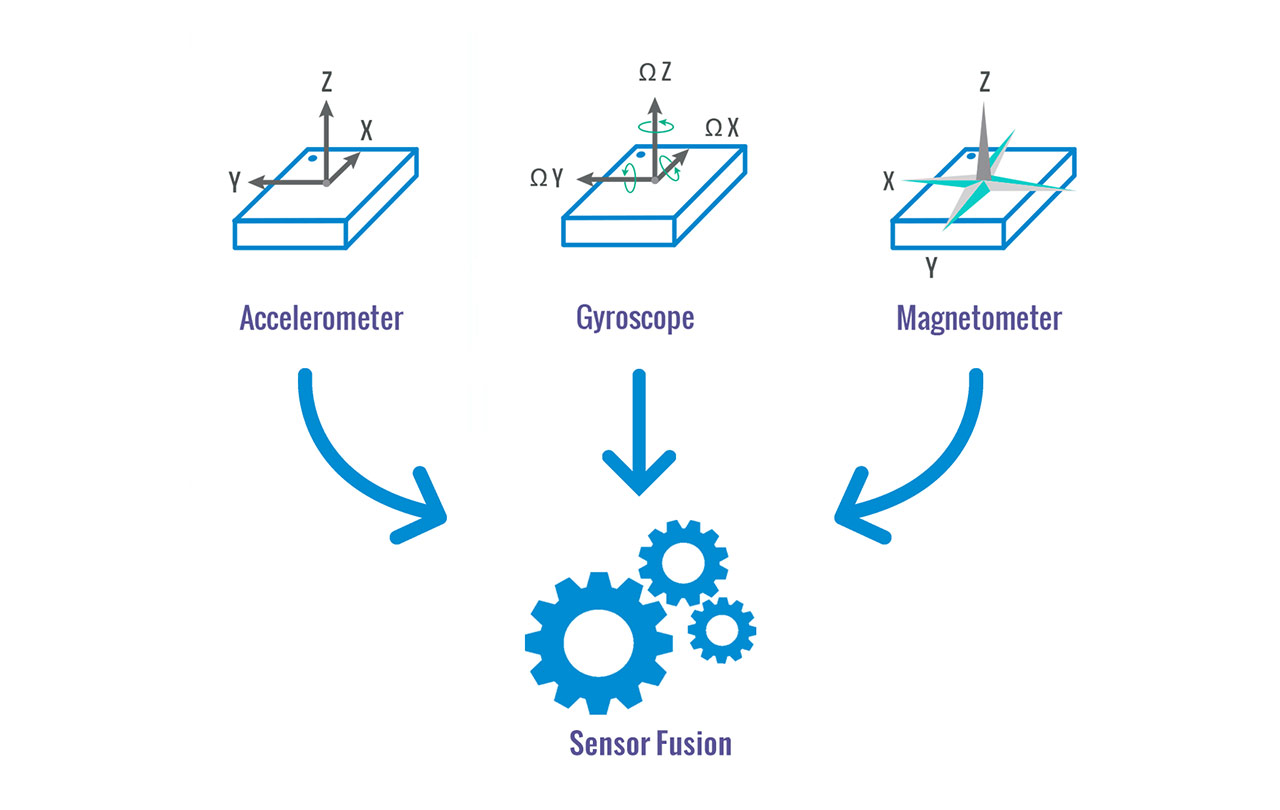
What is Sensor Fusion?

Setting Up Sensor Fusion

UWB Spreads Its Wings for Secure Keyless Access

Shifting Up to a New Level of Edge AI

The appeal of Bluetooth watches


Alexa? Techniques to Pull Clear Speech from Noise – Part II
Sensors, sensors everywhere. Now what do I do?

Using Dead Reckoning to Solve Navigation Challenges

All-In-One Turnkey True Wireless Stereo for Everyone

L2+ and HD Radar: A Golden Opportunity

Contextual Awareness: What Is It, and How Is It Being Used?
Why You Need a Sensor-Agnostic Design

Optimizing AI for embedded applications

Home Surveillance and Security Without the Hassle

Mastering embedded AI

CEVA-powered 2020 in review

Achieving maximum throughput at an attractive price

How Sensors Can Power the Next Generation of PCs

3D Audio for Everyone. The Ultimate Audio Experience
Achieving accurate motion tracking in consumer portables

Building Your Earbuds. What Would You Need?
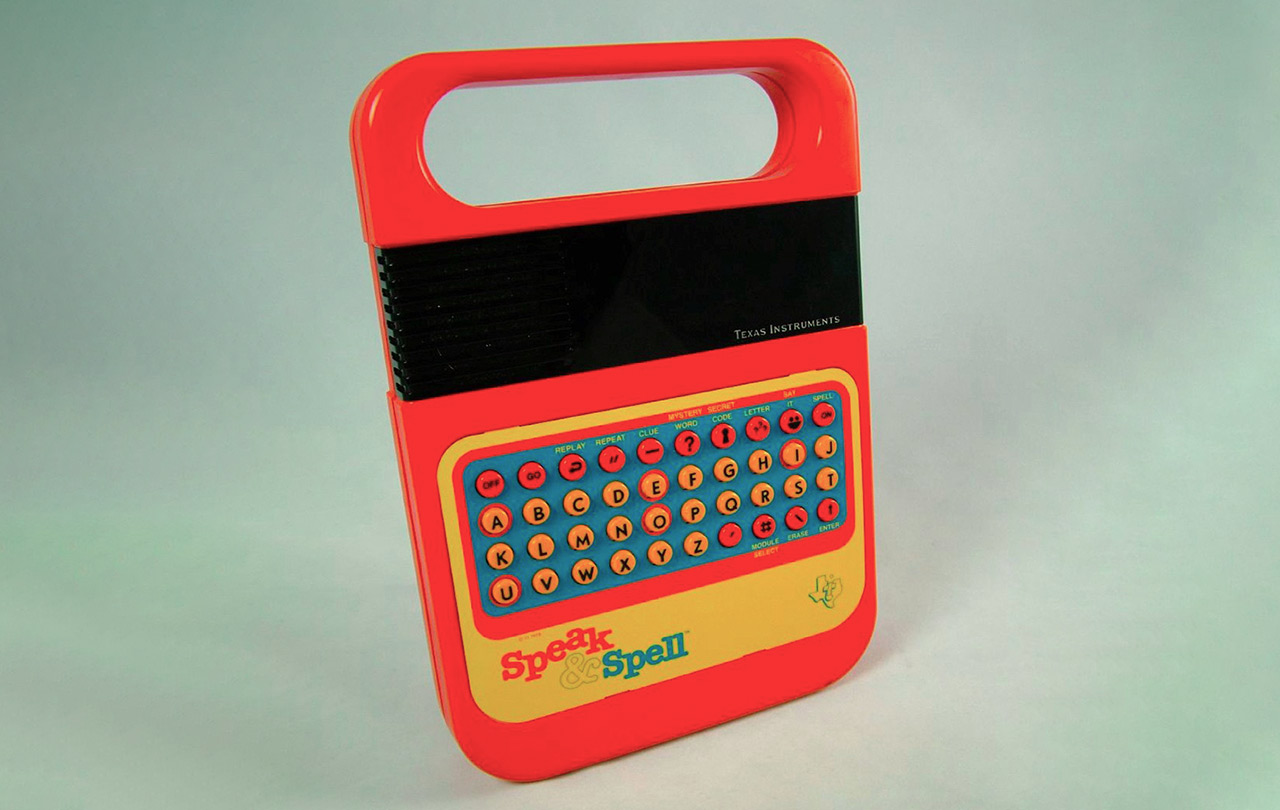
The Evolution of Audio DSPs
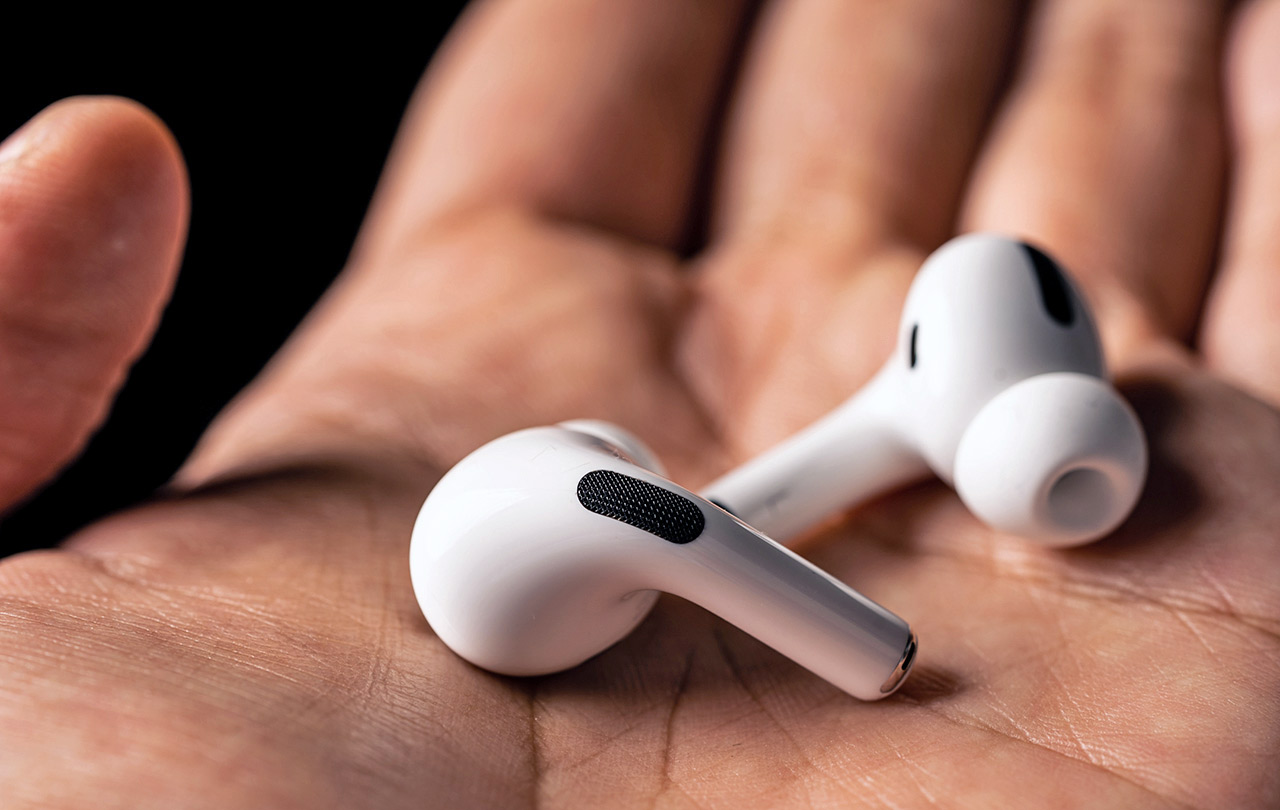
How sensor technology enables context awareness in hearables

SLAM and Multi-Sensing Robots: Soon in Every Home

Advanced Head Tracking for XR Use Cases

5G Infrastructure Needs Chips!

Powering Human Presence Detection with Sensors

Satellite NB-IoT: Connectivity Everywhere

How motion tracking enables user convenience
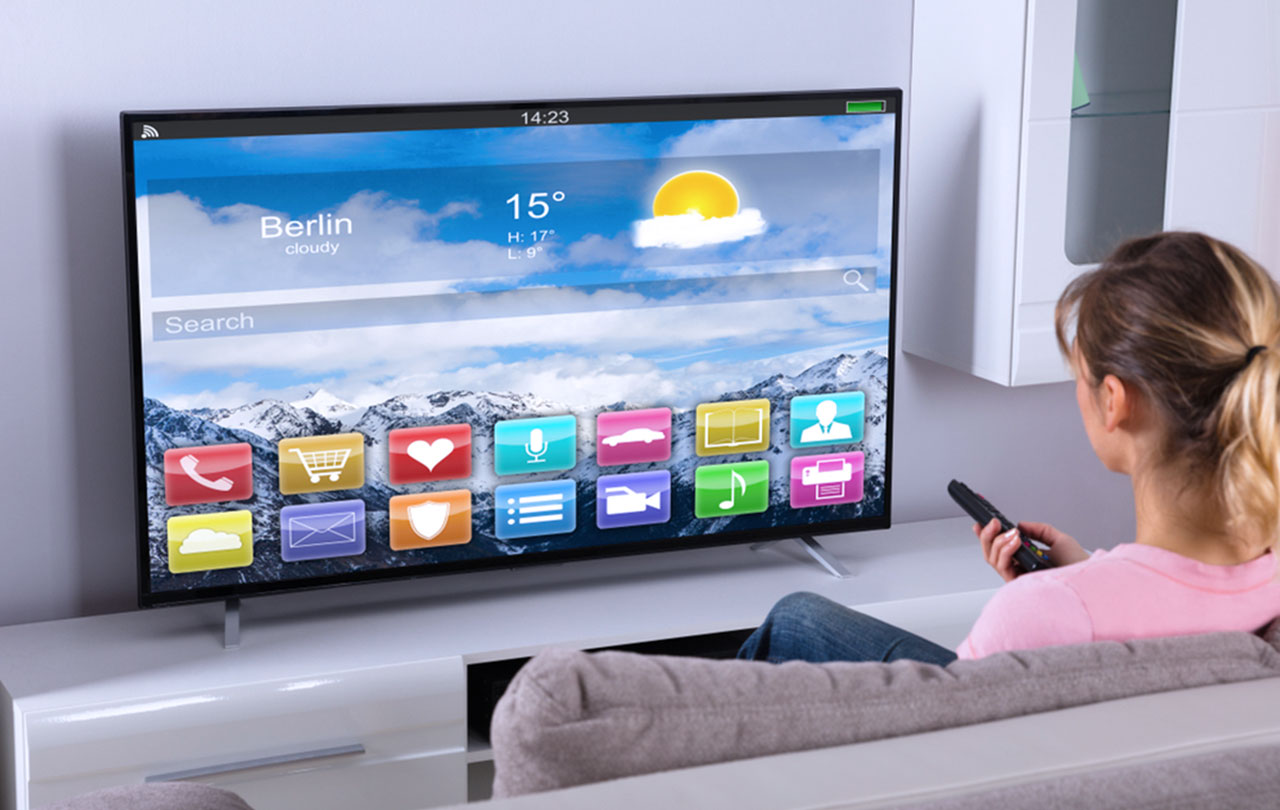
Smarter tv, remote compete with telephone

Aural Reality: Connecting Beyond the Internet

Integrating Sensor Fusion

Wi-Fi muscles in on 6 GHz

Easing the development of visual SLAM applications

Context Awareness, UX and You (and Your Computer)

Ultra-Wide is Ultra-Hot, and a Lot of Work

The 5G Infrastructure Race is On

Why Sensor Fusion Is the Answer to Audio Contextual Awareness

The Importance of Capturing Dynamic Motion for Medical Wearables

How handheld motion control enables UX/UI features

Bluetooth SIG Releases LE Audio at CES

Get Ready for Aural Reality

How Motion Sensing Enables Next-Gen Stylus Features

How DSP Supports Always-On Functions

Decisions, decisions: Hardware accelerator or DSP?

When a DSP beats a hardware accelerator

Why DSPs are suddenly everywhere

How Motion Sensors Can Revolutionize Hearables
Tool support in optimizing your DSP application

Image Processing and Computer Vision in One Package: A Logical Next Step

Optimizing software for your DSP application

NB-IoT Poised to Take Off, Waiting for a Trigger
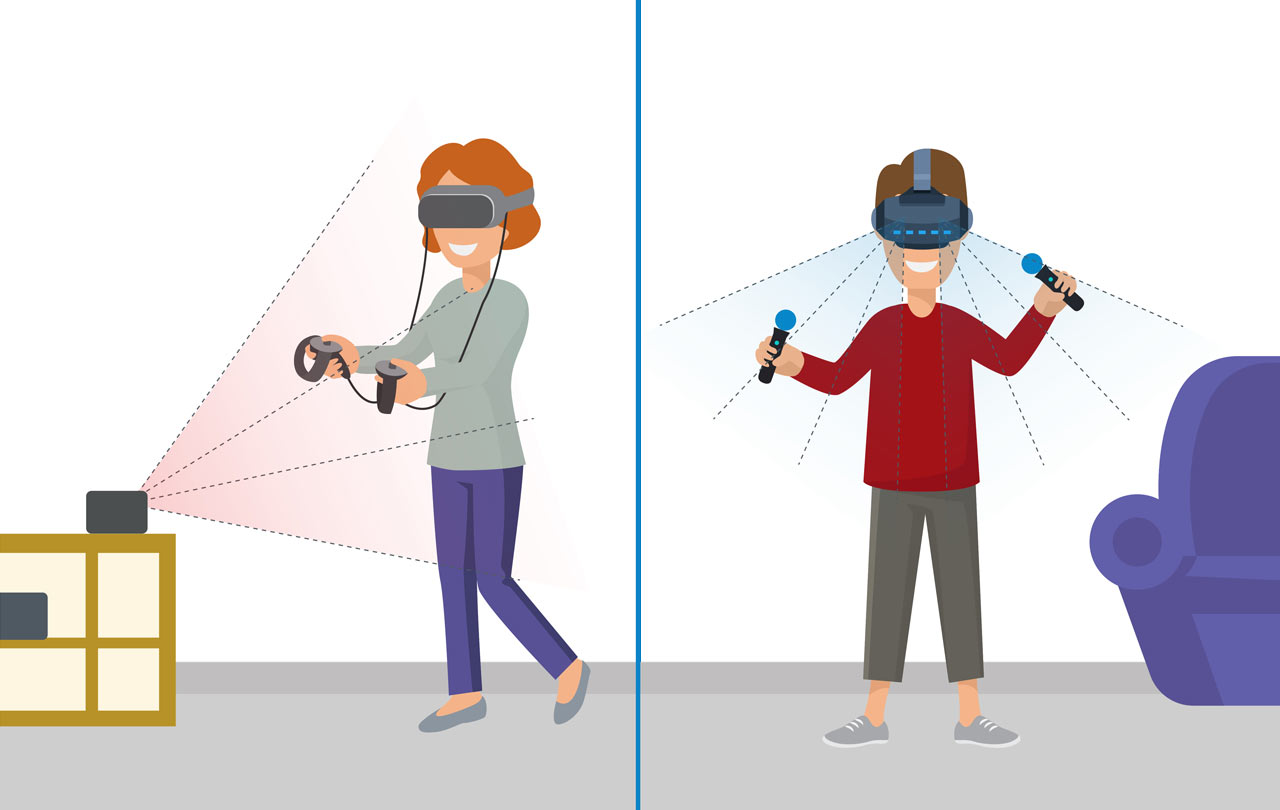
Using Algorithms to Achieve Frame Alignment in AR/VR

Neural networks address the challenges of CSI reporting in 5G NR
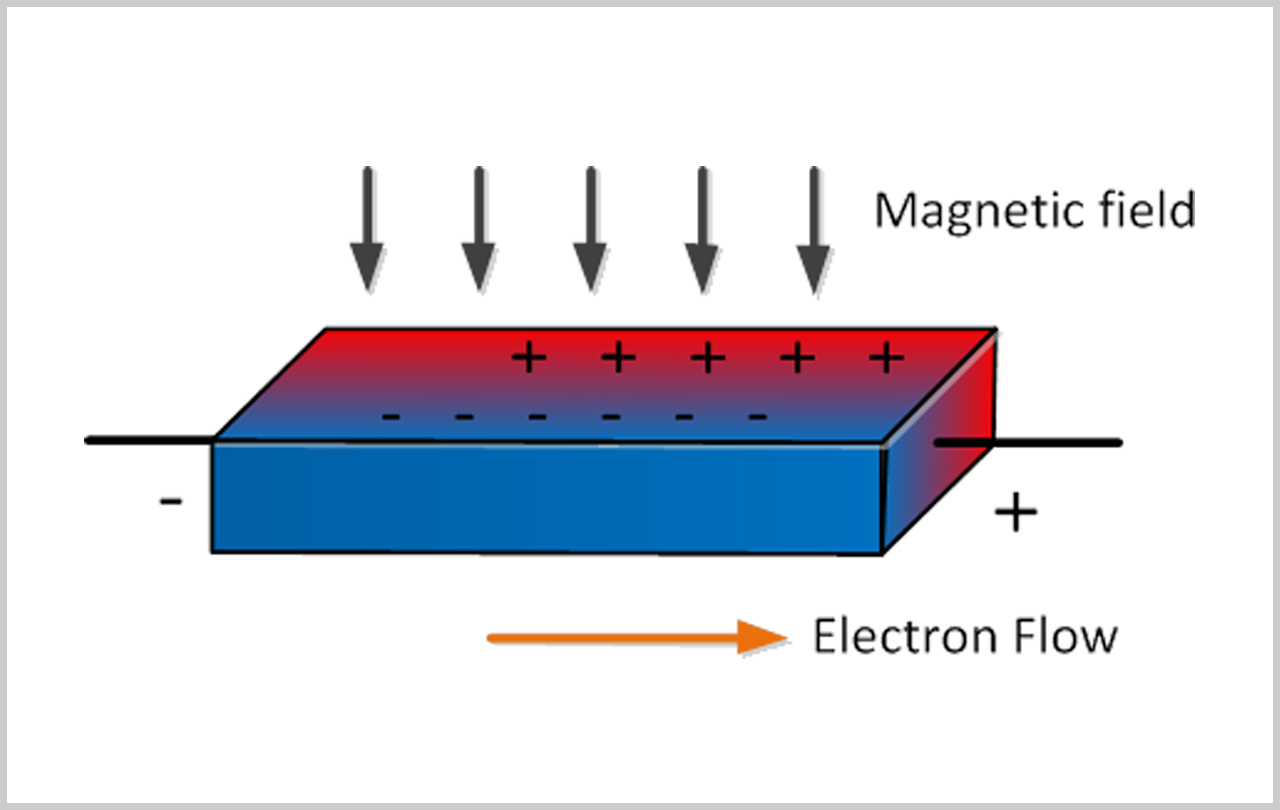
When to use a Magnetometer (and when you shouldn’t)
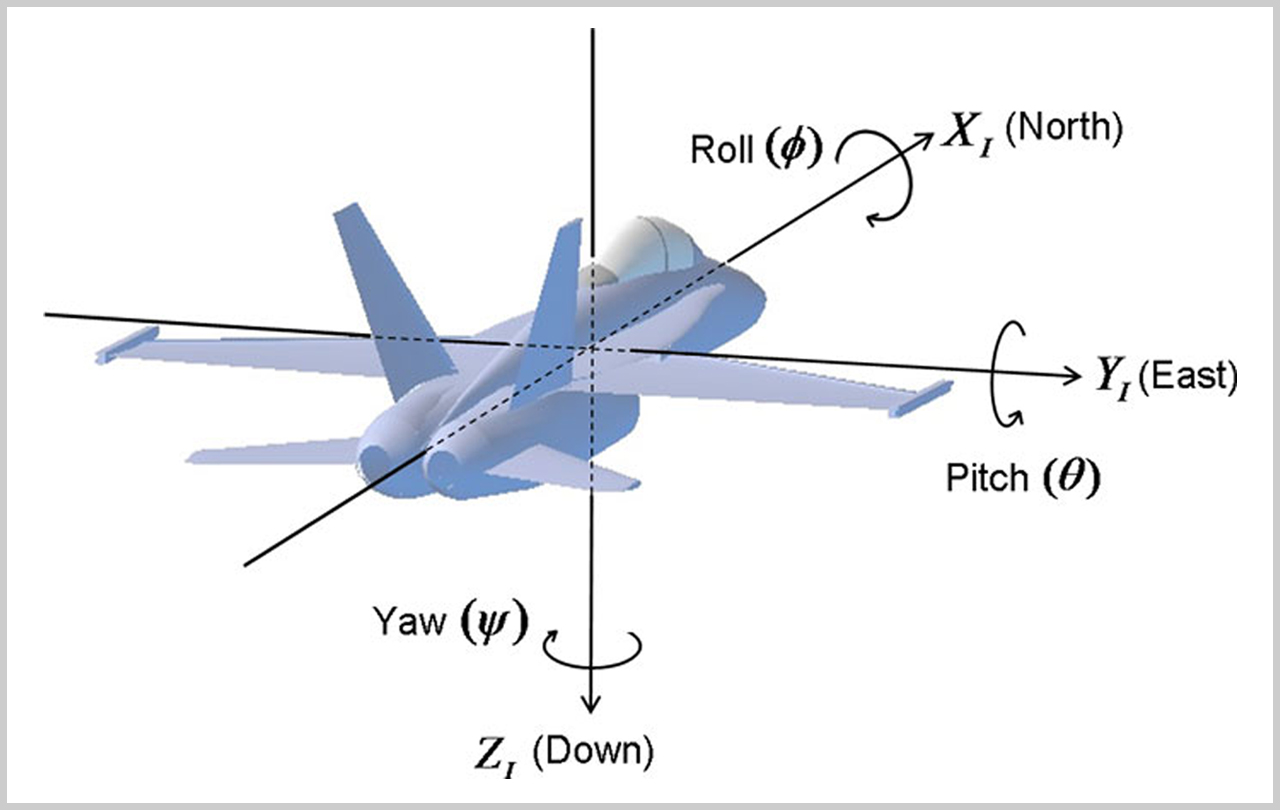
What is a Quaterion?

China Reinforces Leadership in 5G

How IMUS are used in VR Applications

Autonomy Aspirations Pivot to Immediate Opportunity

Privacy Issues with Voice Interfaces

Smart AI Assistants are the Real Enabler for Edge AI

Watch out Watches – Smart Hearables Are Coming
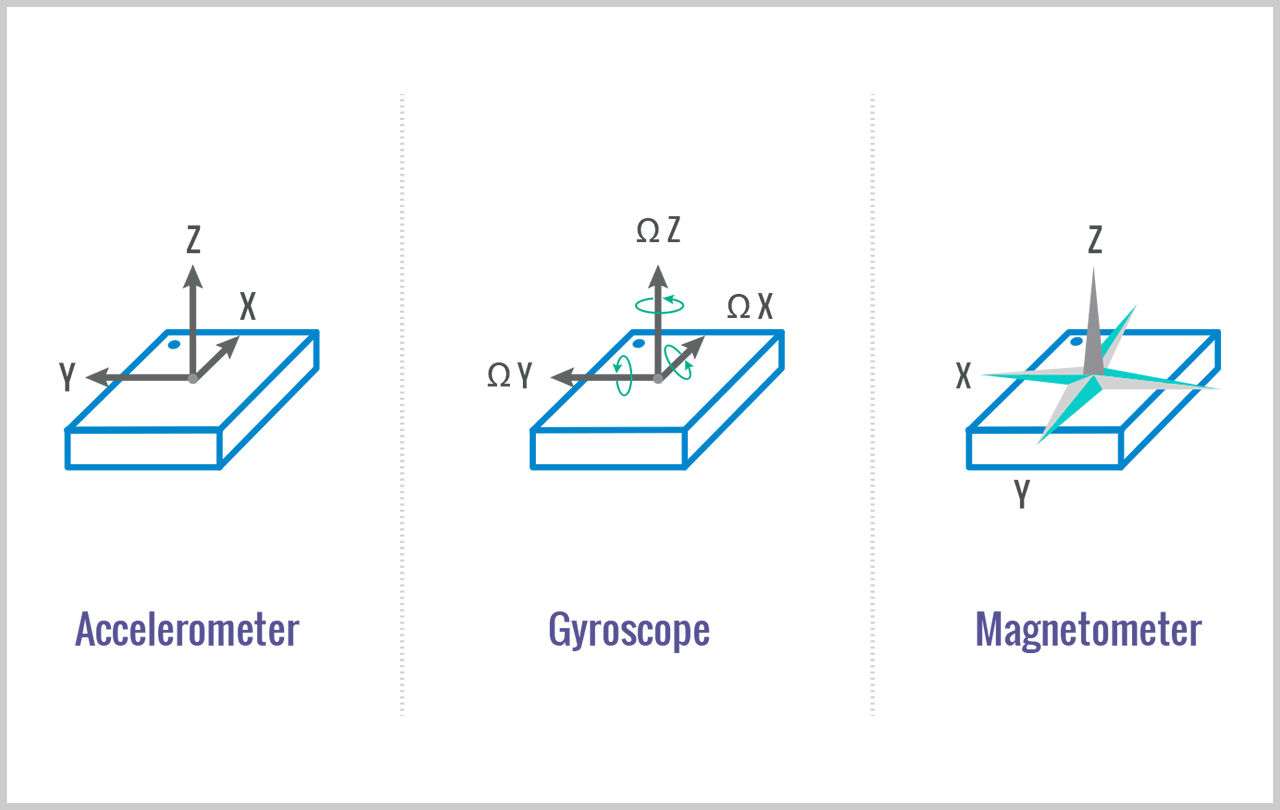
Optimize your IMU with Dynamic Calibration

DMS Given Green Light to Increase Road Safety
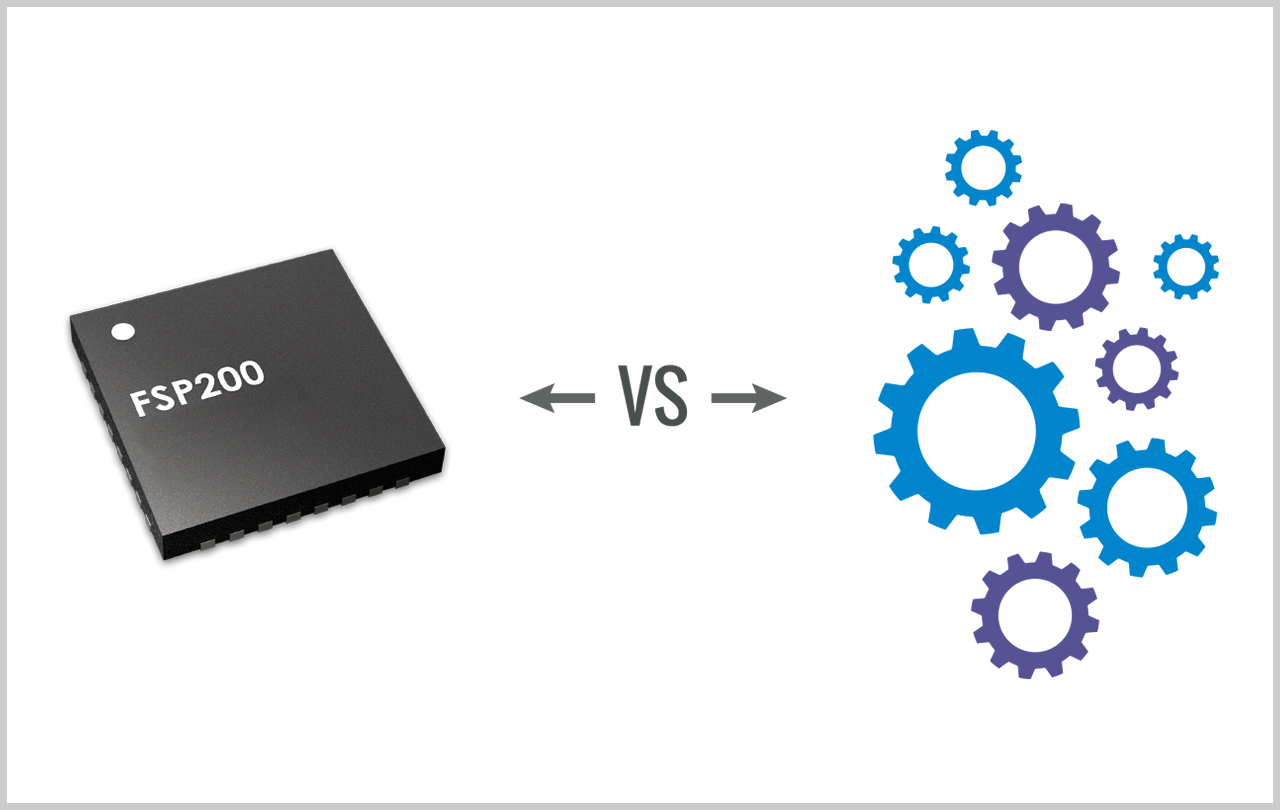
Sensor Hub v. Sensor Fusion: What’s the Difference?
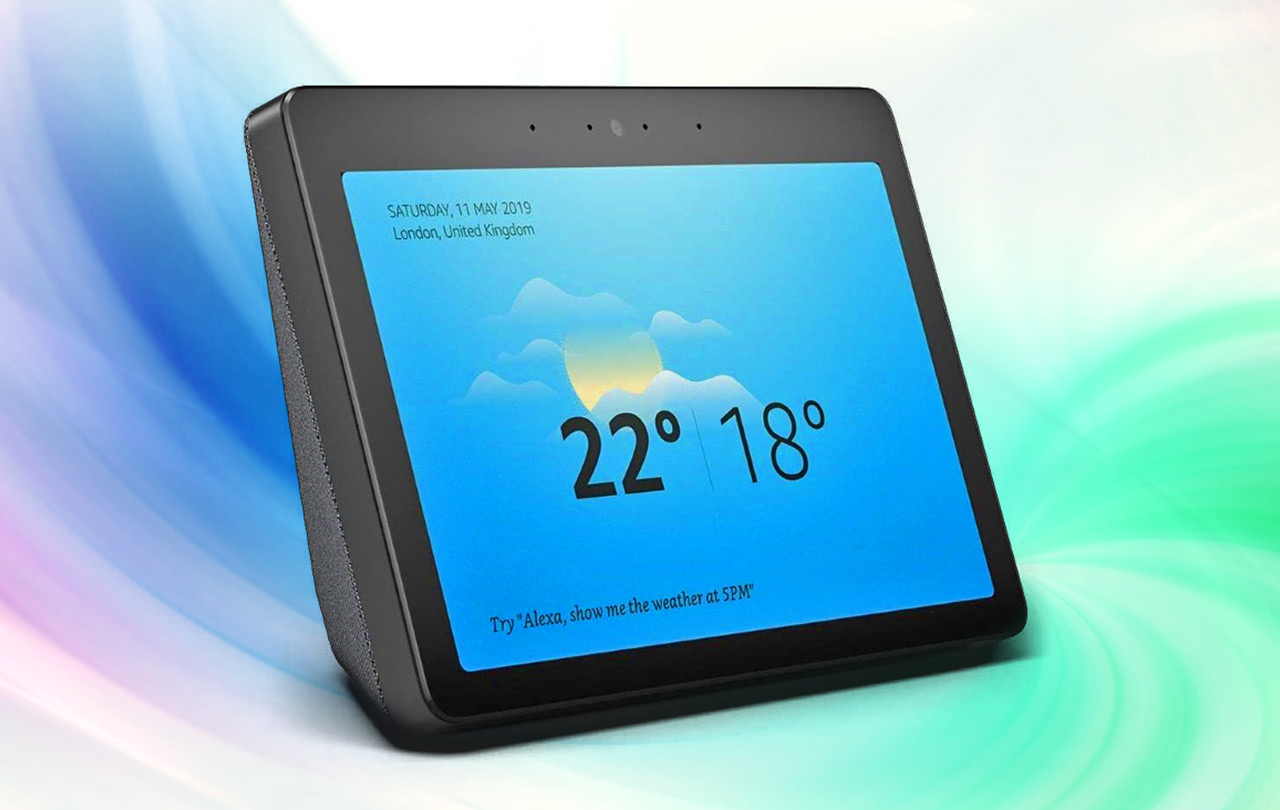
Smart Displays are Smarter Than They Look

The Challenges for AR/VR to Go Mainstream

Bluetooth 5.1 Refines Location Accuracy

Hybrid DSP+Controller: The Sweet Spot for IoT Processing
Motion Sensors: The Future is Now
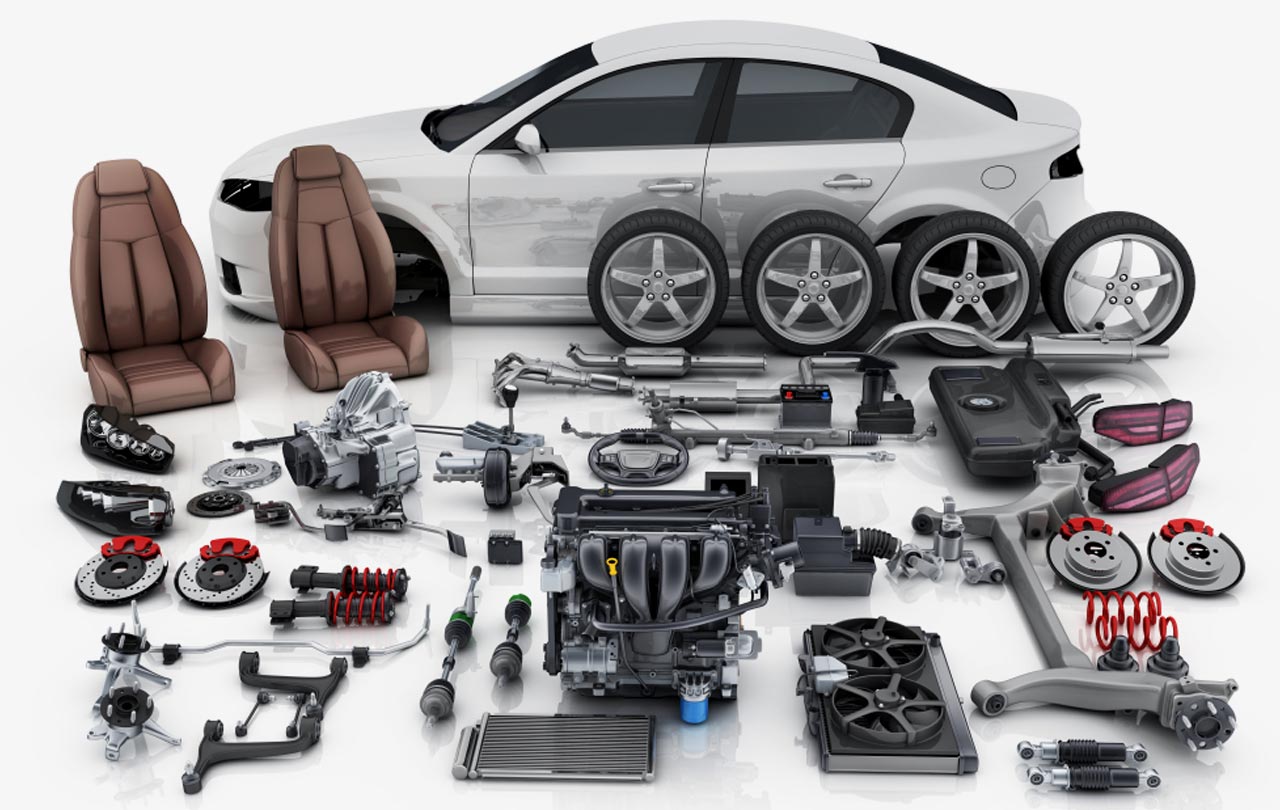
The Banality of Bringup Evil

The Complexity of Hardware Debugging – Part #2

The Complexity of Hardware Debugging – Part #1
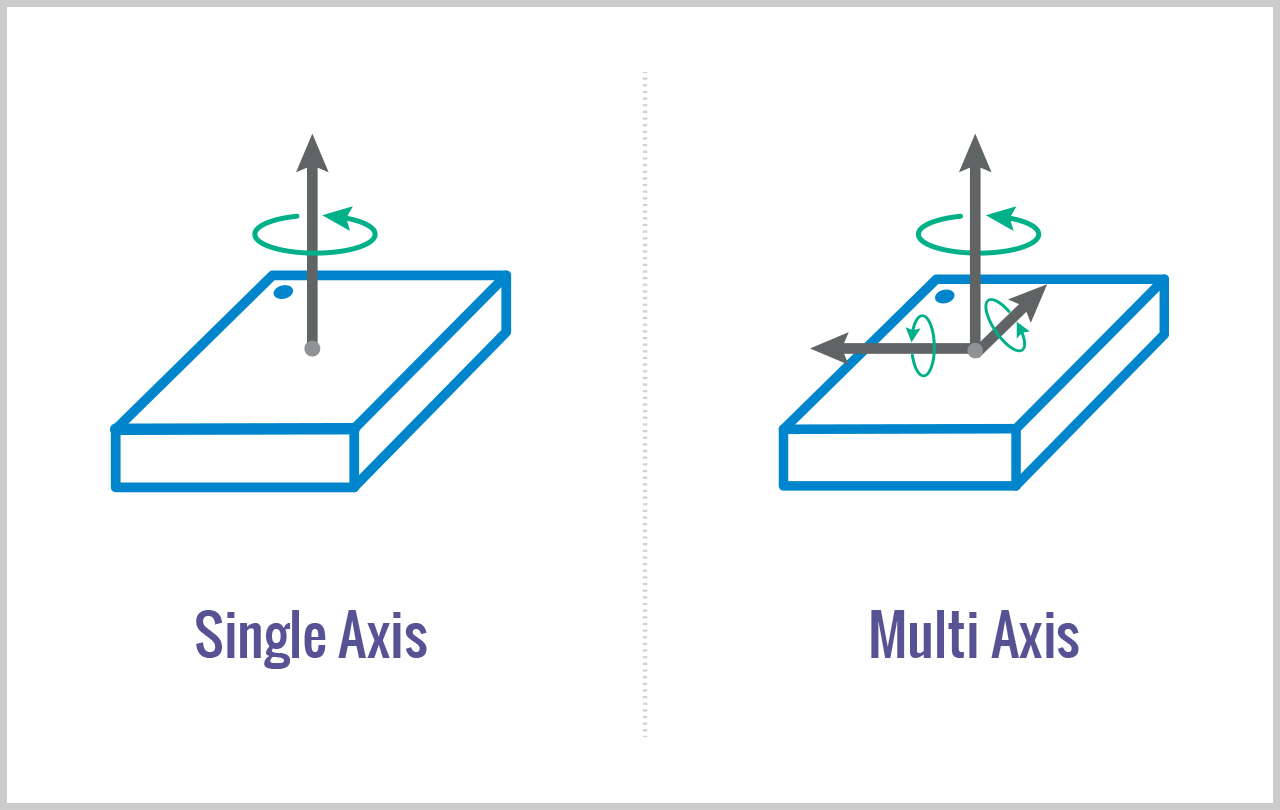
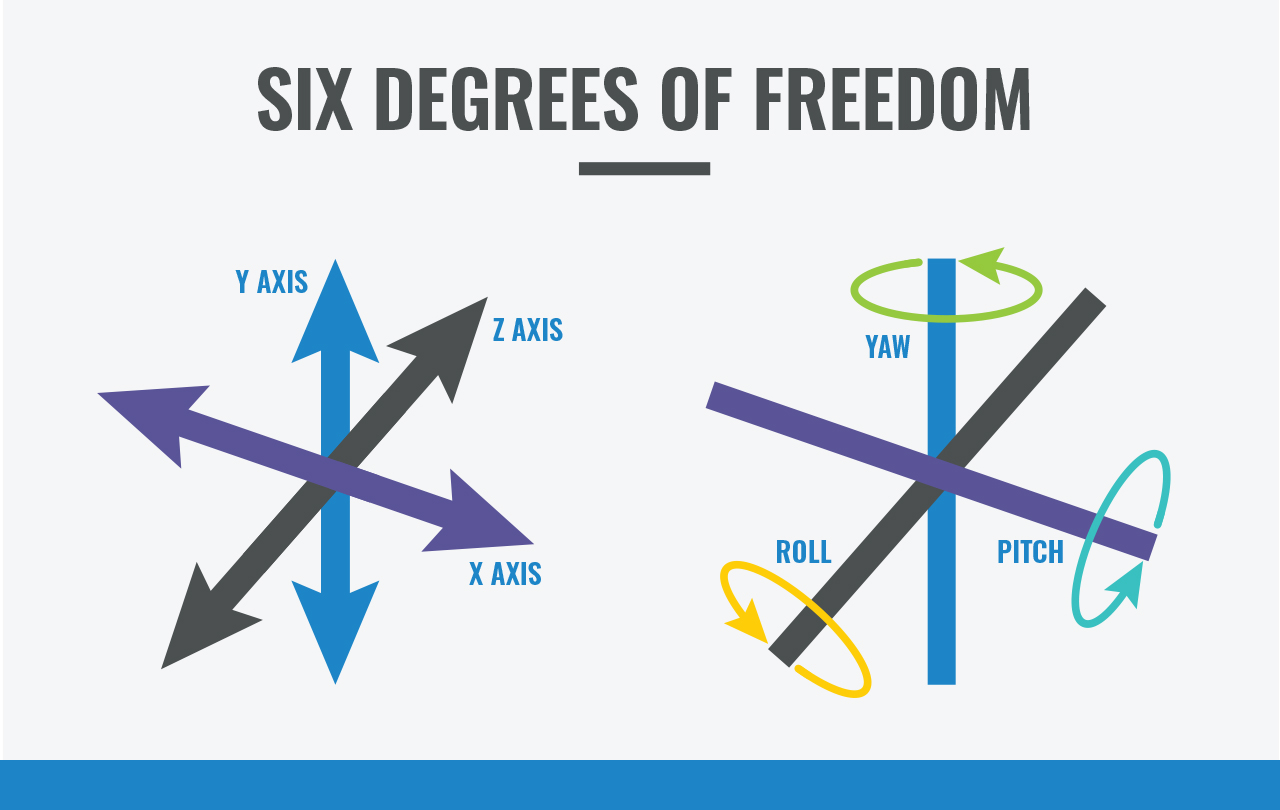
Motion Sensors: How Many Axes Do You Need?

Smart Video Surveillance is Growing Ears

The democratization of the voice interface
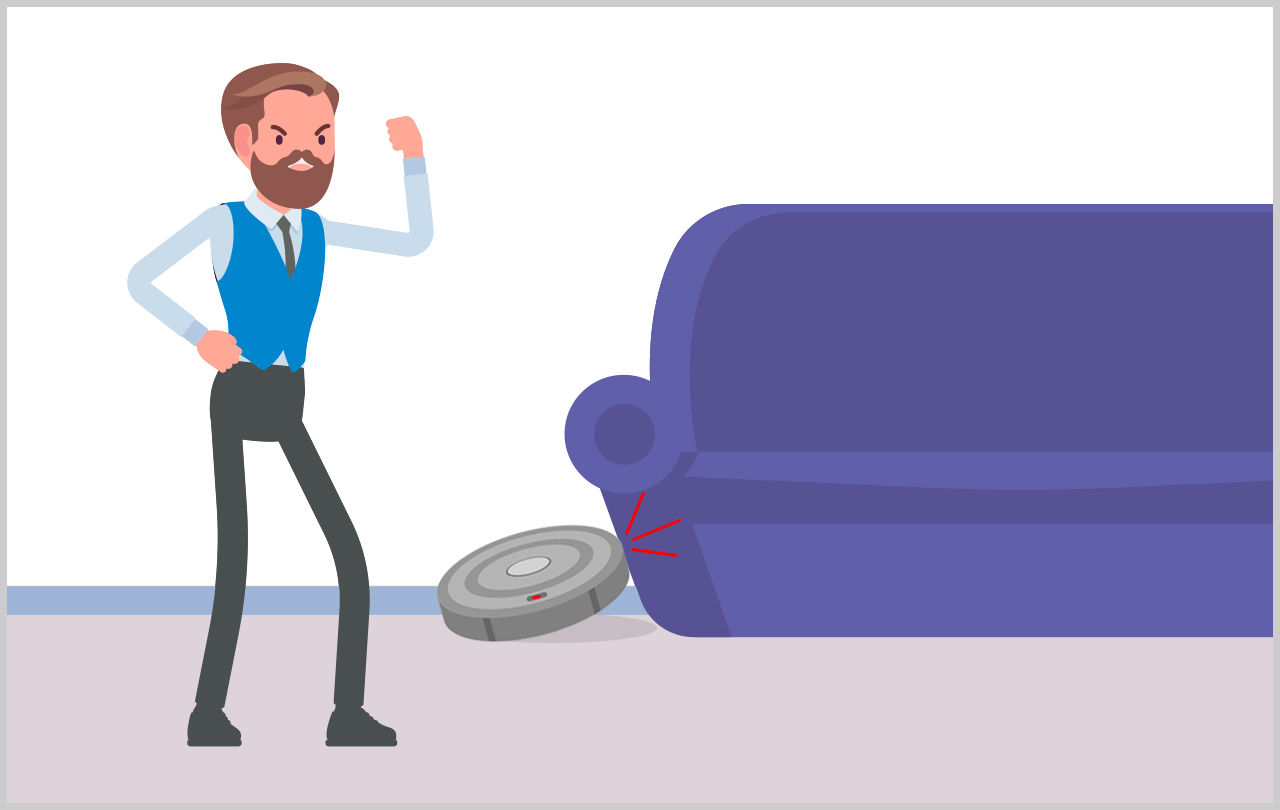
Solving Robotic Vacuum Challenges for Tomorrow’s Consumer

How to Evaluate a Sensor Vendor
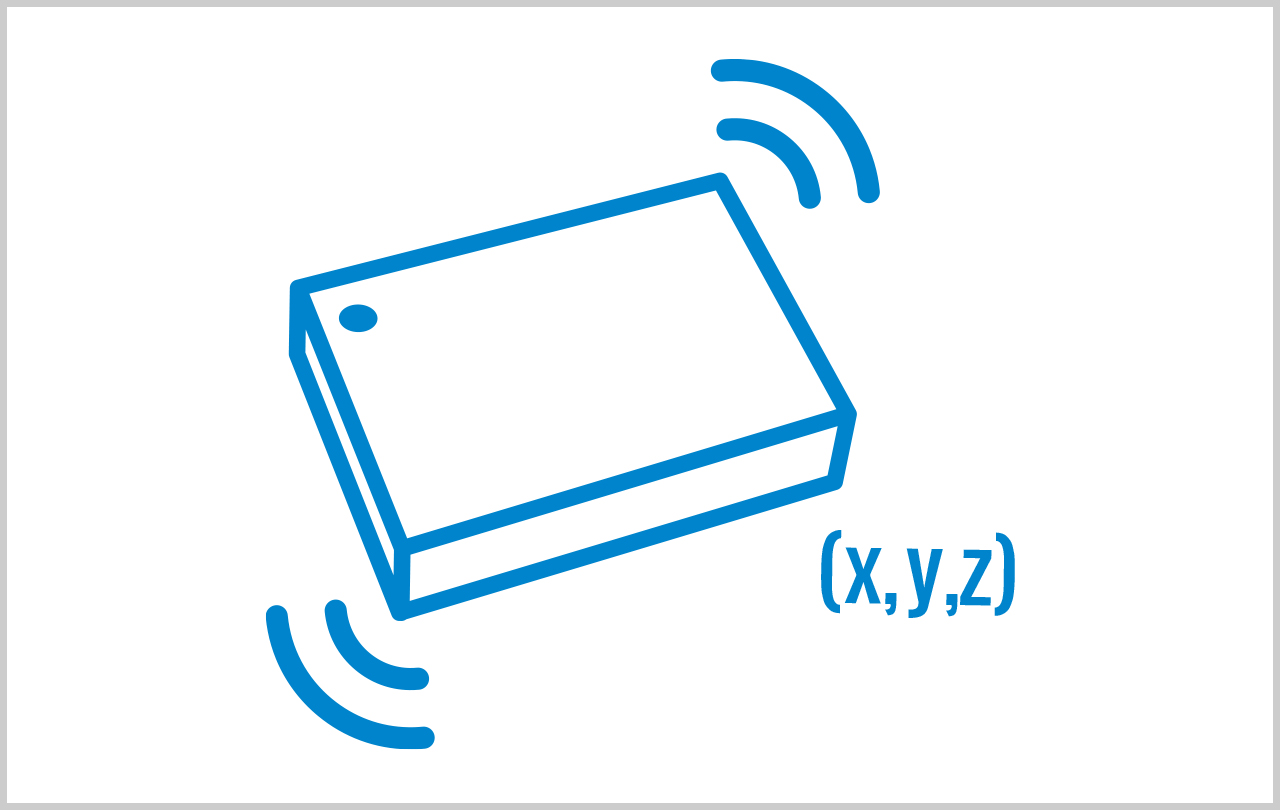
Sensor Technology: Deciphering your Choices

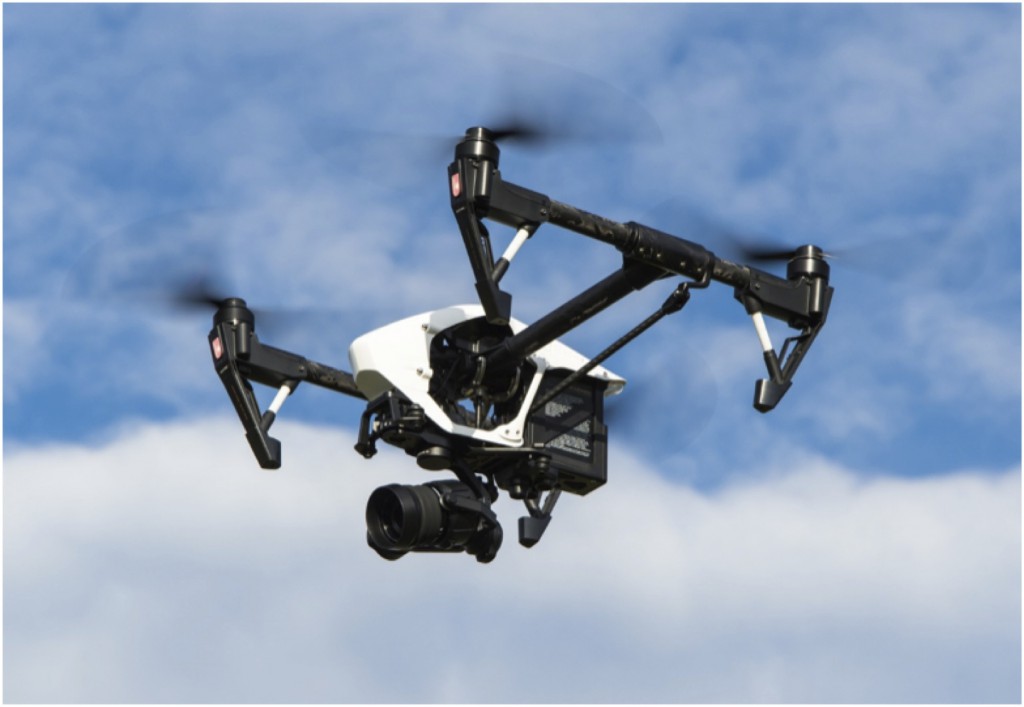
The rise of the machines: Why drones are tech leaders
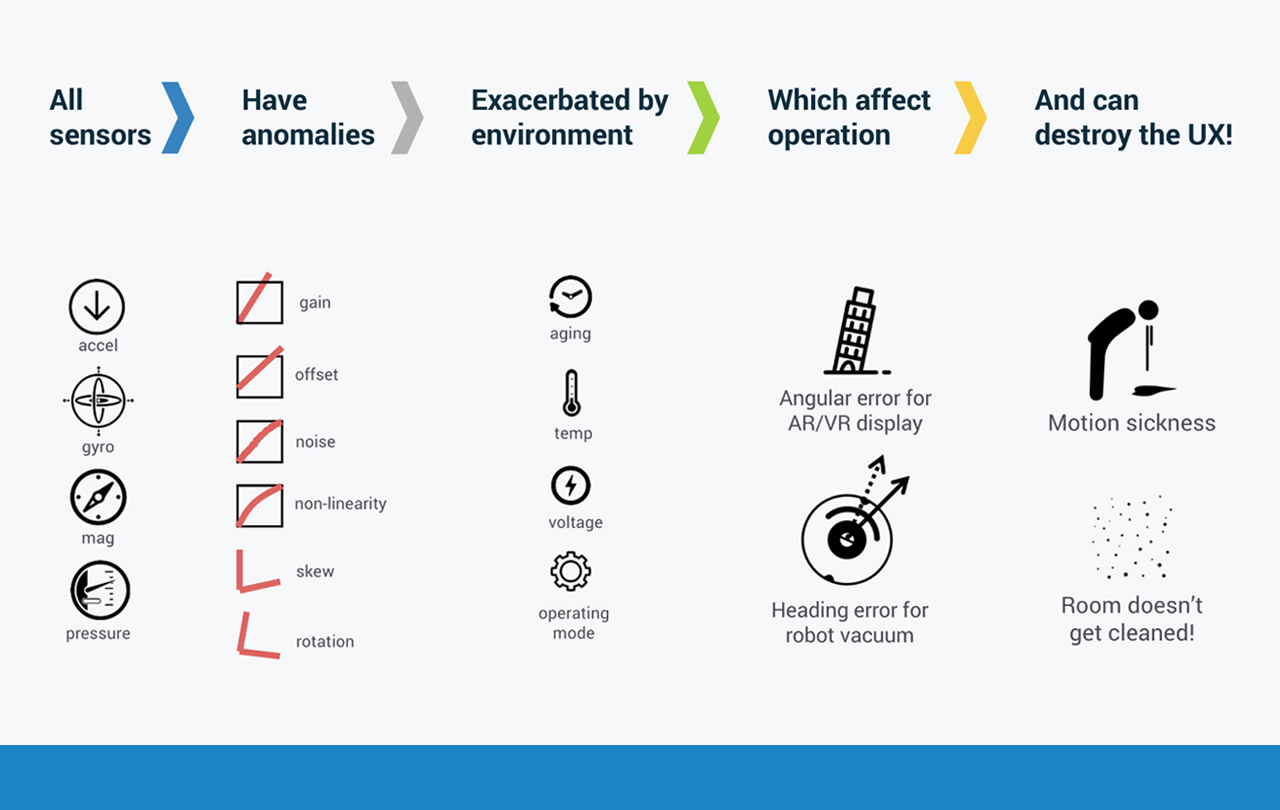
Universal Technical Challenges in IMUs
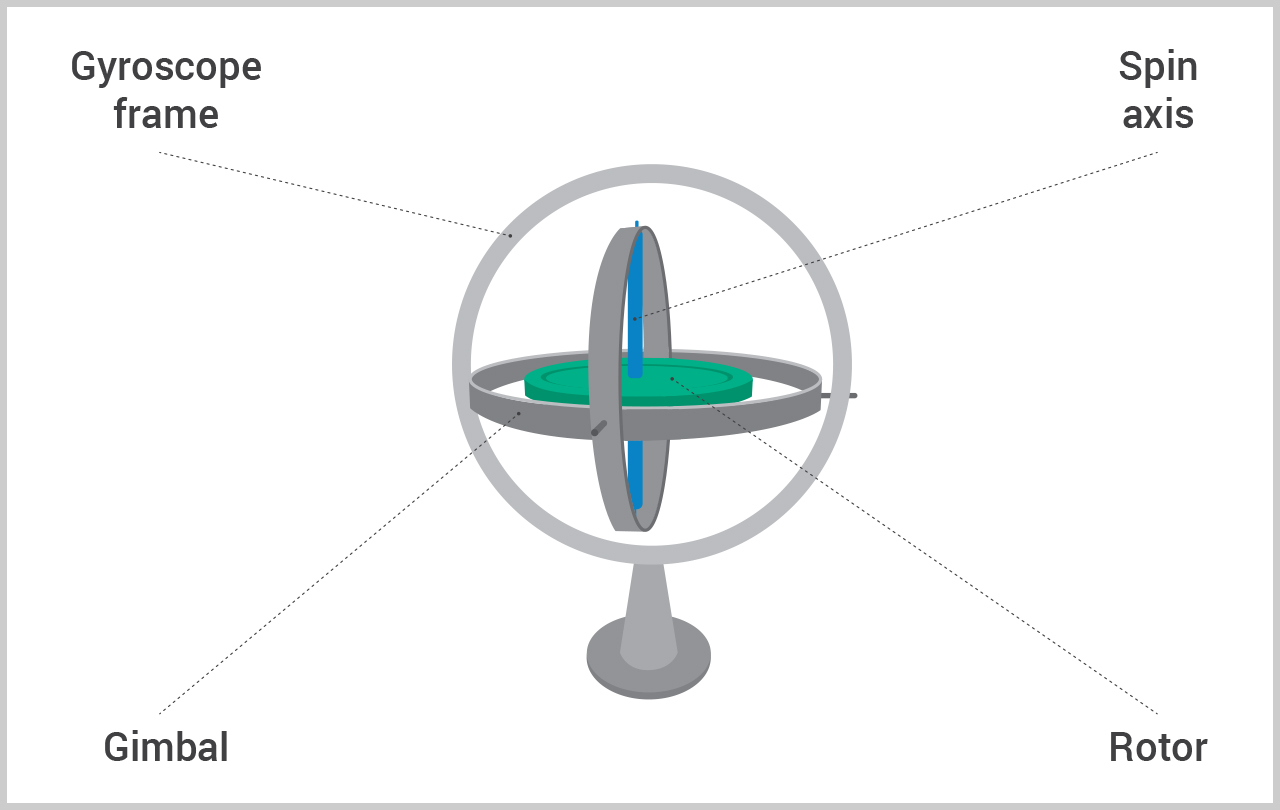
Exploring the Application of Gyroscopes

Opportunities and Challenges in Cellular IoT

What is an IMU Sensor?

Getting to True (and Non-Captive) Wireless Stereo

Making Personal Robots Ubiquitous

To Centralize or Distribute – That is The Question
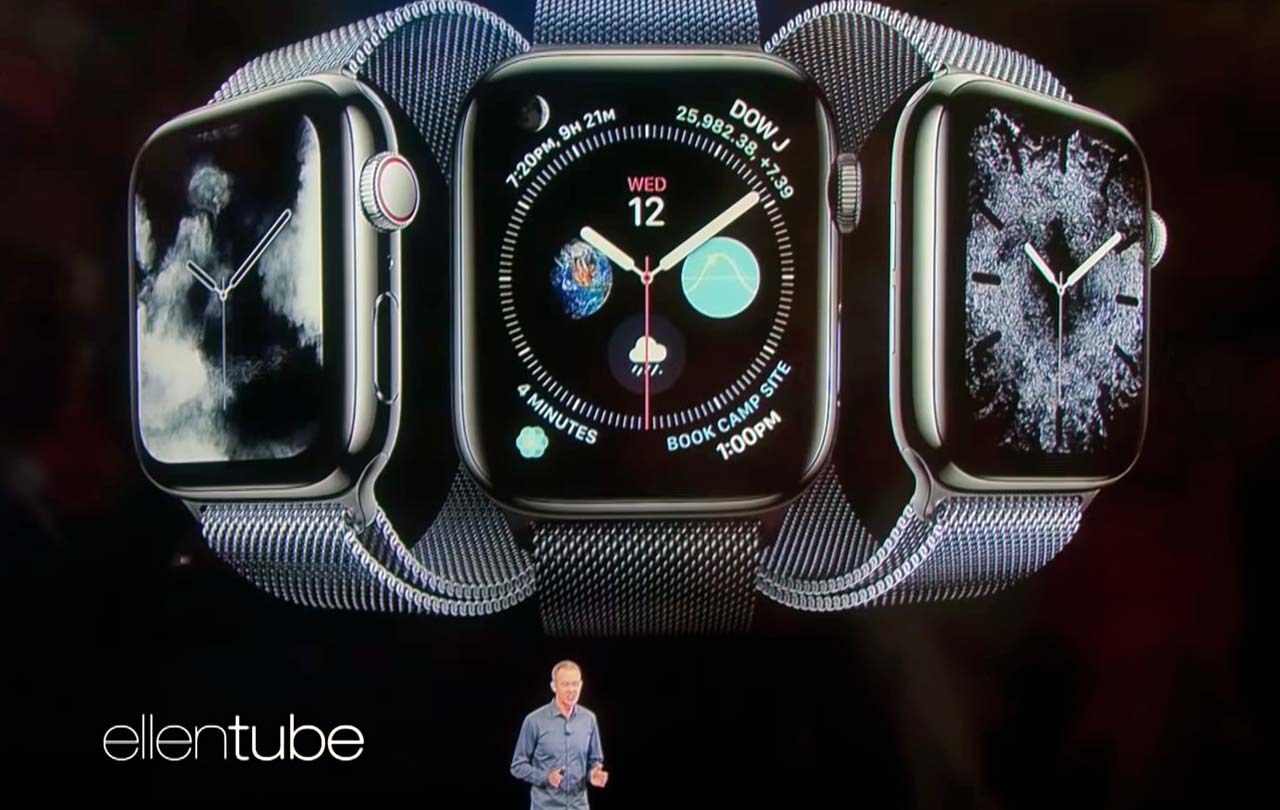
New iPhones and Watch Reinforce Apple’s Technology Leadership

Wireless Earbuds – Improved Convenience, constrained Audio quality

Bringing Deep Learning to IoT Edge Devices

Why Some Embedded AI Processors Are Smarter than Others
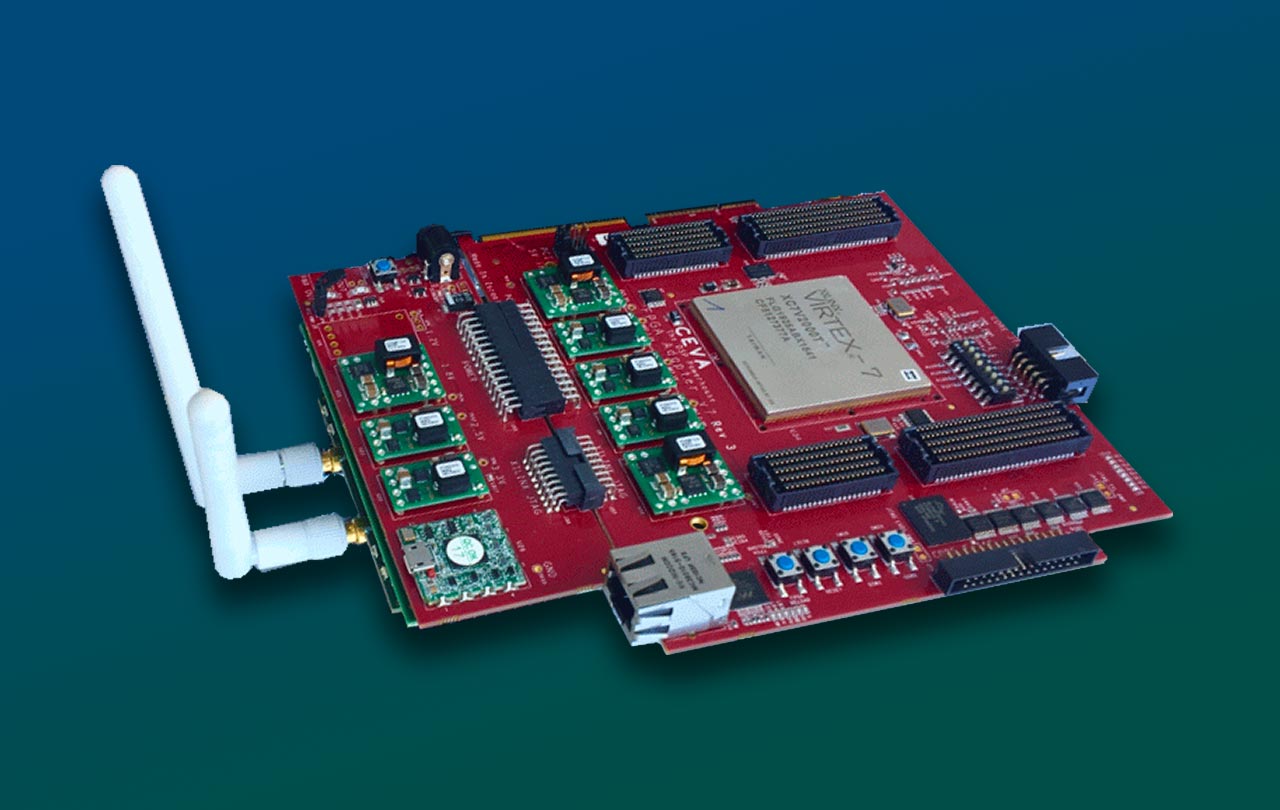
RISC-V Open Source Transforms IoT Processor Design

Machines Can See, Hear and Analyze Thanks to Embedded Neural Networks

From Noise and Echoes to Clear Speech: The Voice Activation Frontend

When audio over BLE meets always-on voice activation

Implementing a mesh network? Here’s why you should use Bluetooth
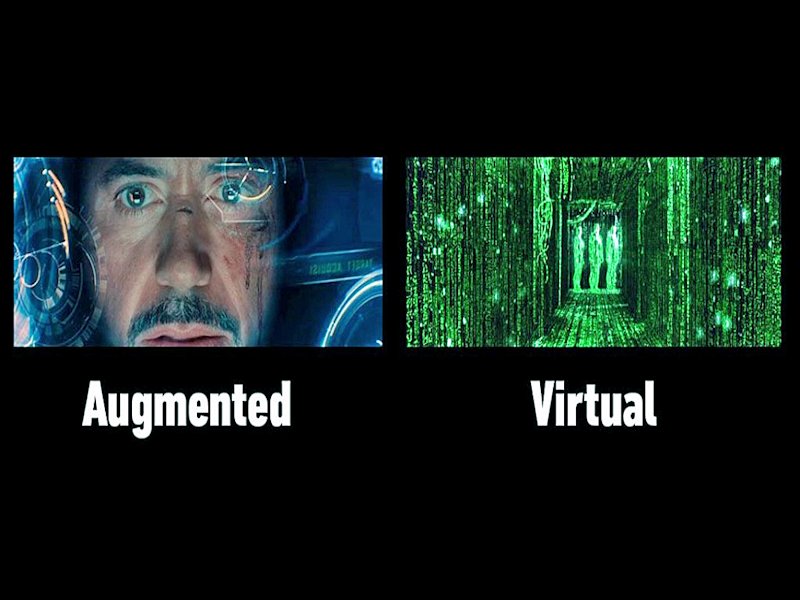
Efficient Processing Paves The Way For High-Quality AR/VR

Will the iPhone 8 include a dedicated neural network engine?

Mobile VR comes with its own set of challenges
The second wave of smart speakers is coming
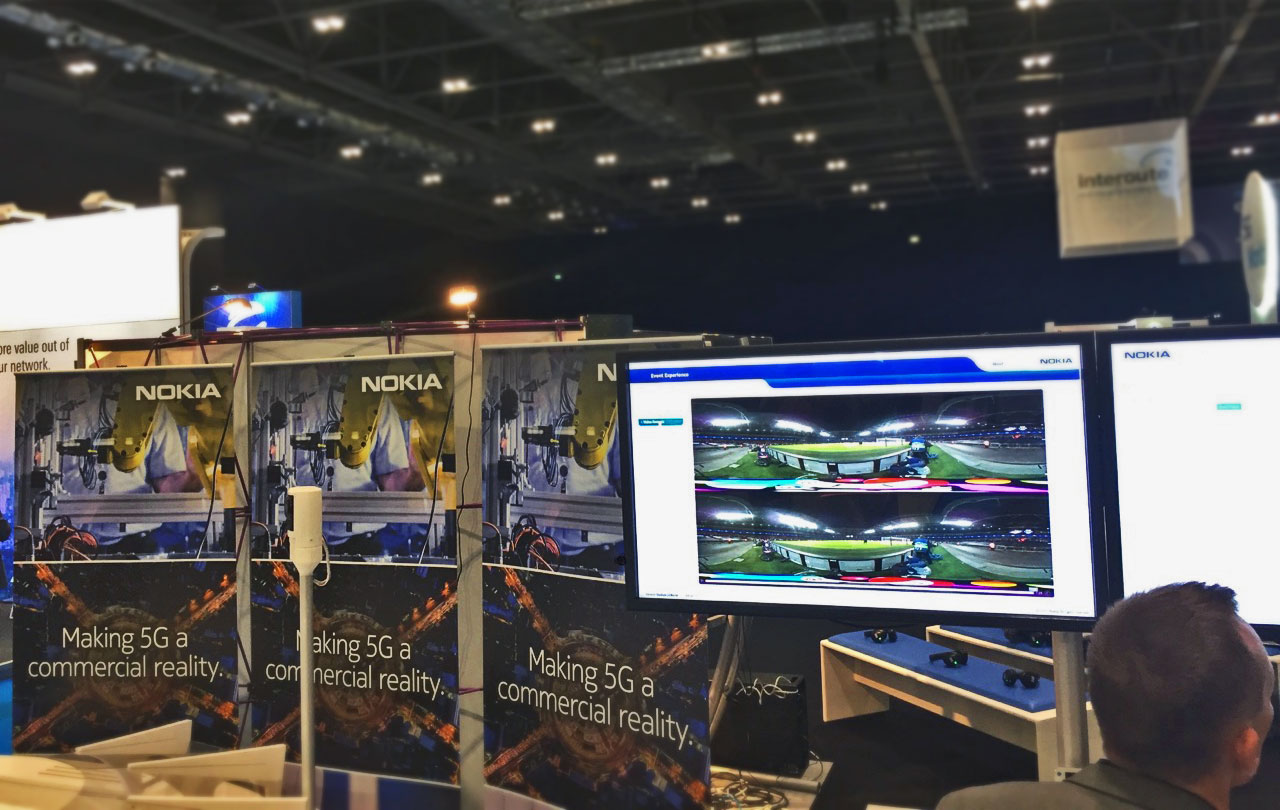
What’s going on in the 5G World as of mid-2017?

Voice interfaces of the future
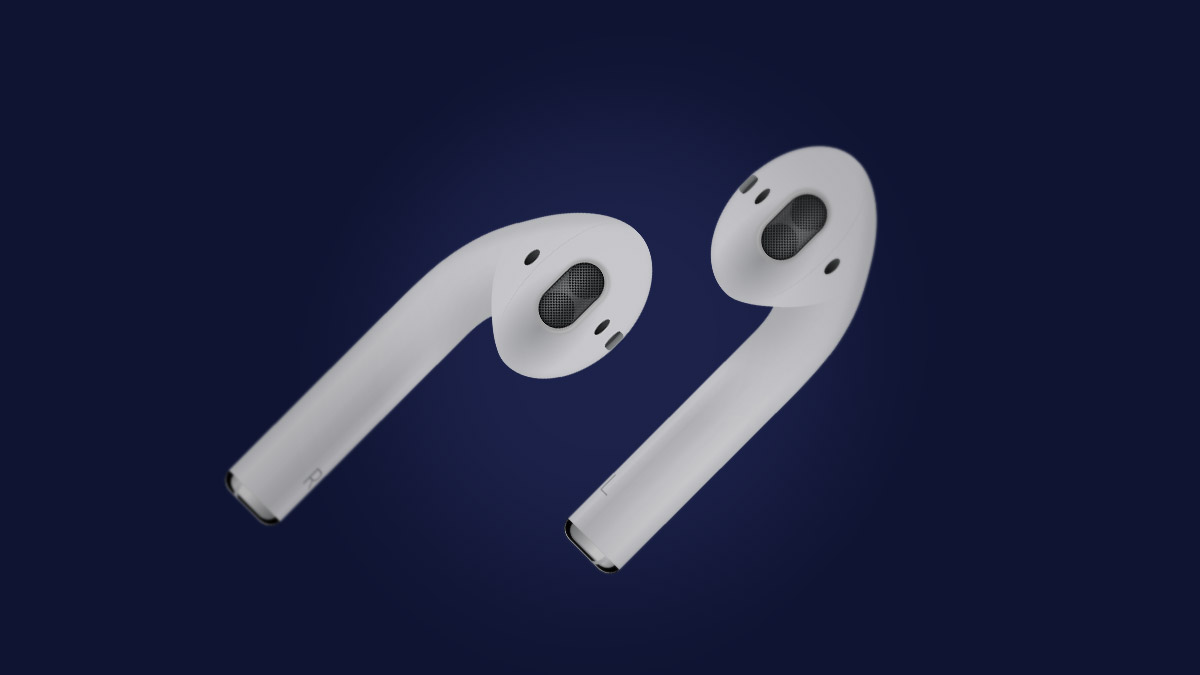
Bluetooth audio streaming is everywhere and improving

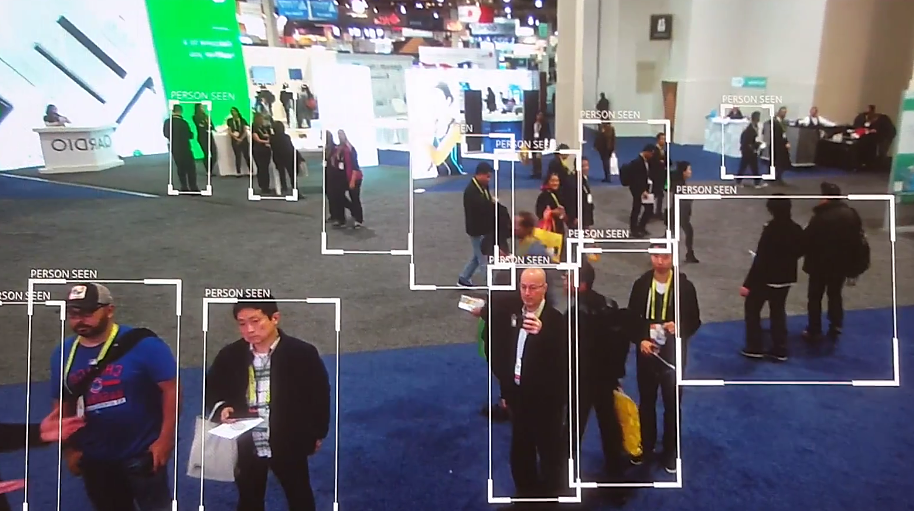
CES 2017: Promises of Past Years Have Matured into Useful Products
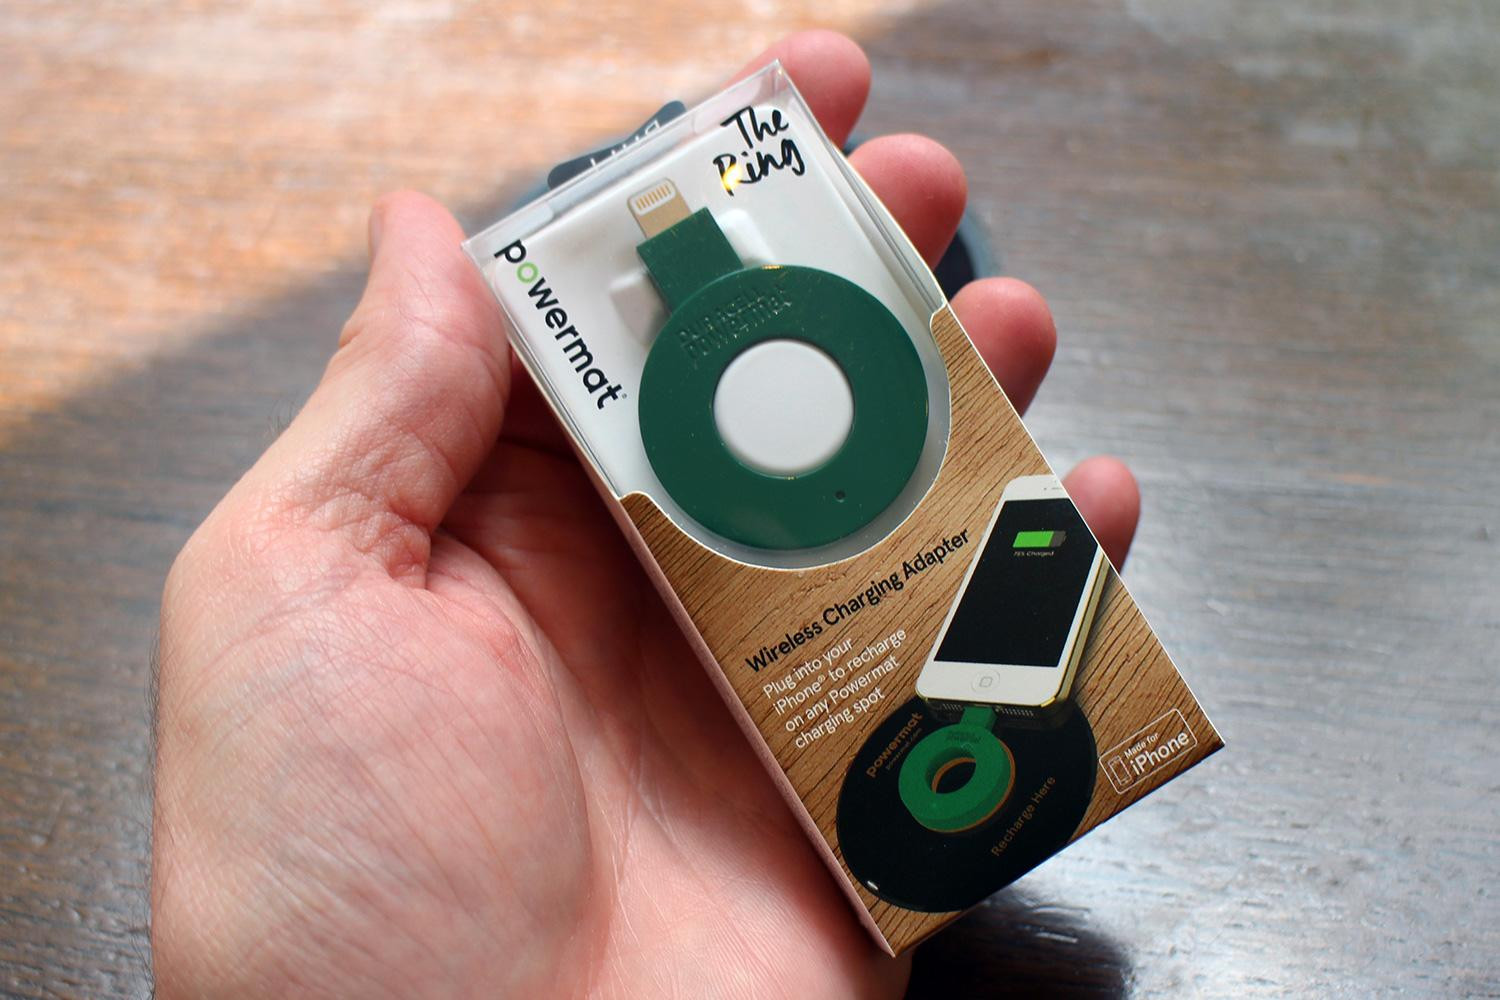
Why your device and your charger should talk over BLE

New Bluetooth 5 Spec Sets the Stage for a Faster, Better IoT



CEVA Q3’16 Earnings – Going from Strength to Strength


CDNN: Generating an Embedded Neural Network at The Push of a Button


The Future of Smartphone Photography: Dual Cameras Meet Machine Learning

Smart Grid Communication: PLC and ZigBee on Programmable DSP
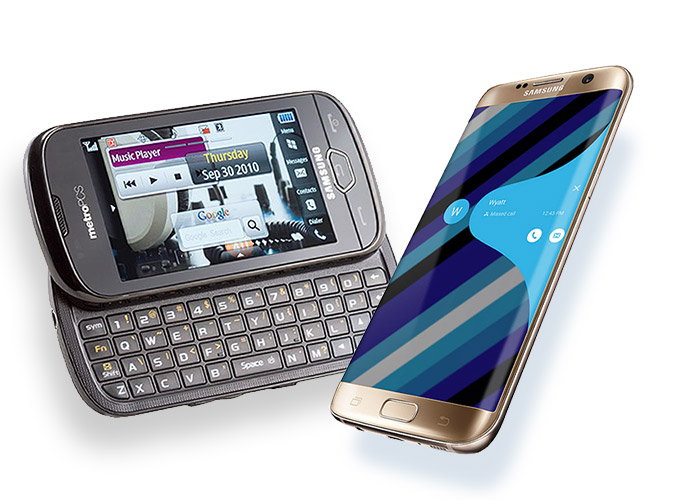
A look at CEVA’s heritage in LTE, and what’s next


Another look at AlphaGo vs. Lee Sedol: The Power Angle

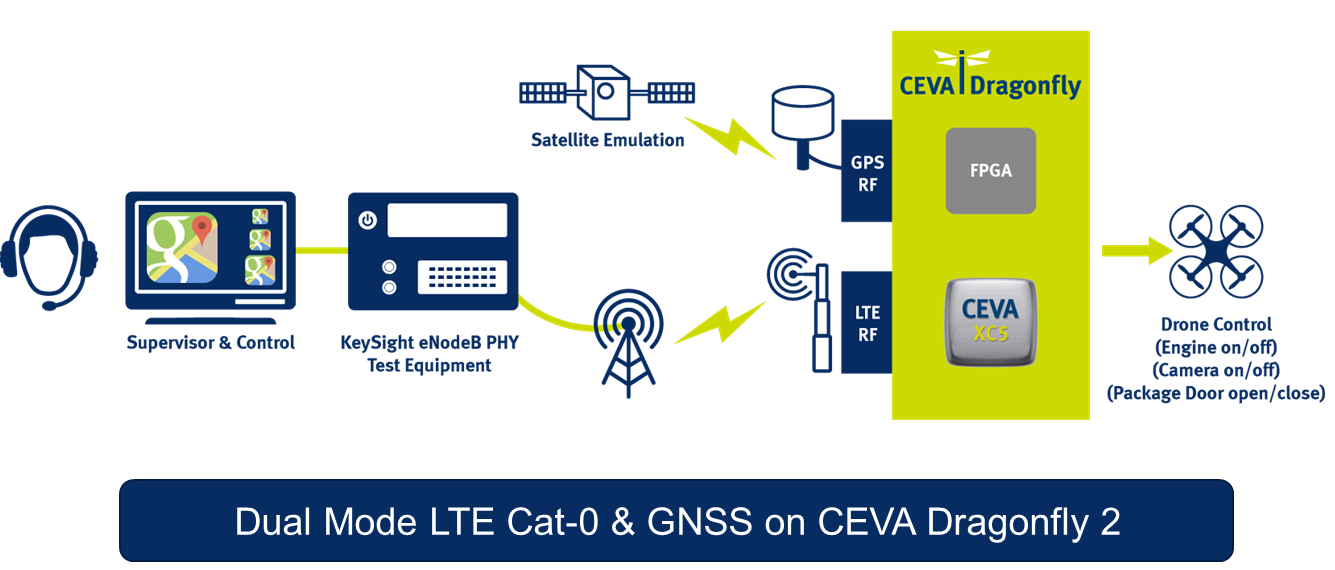
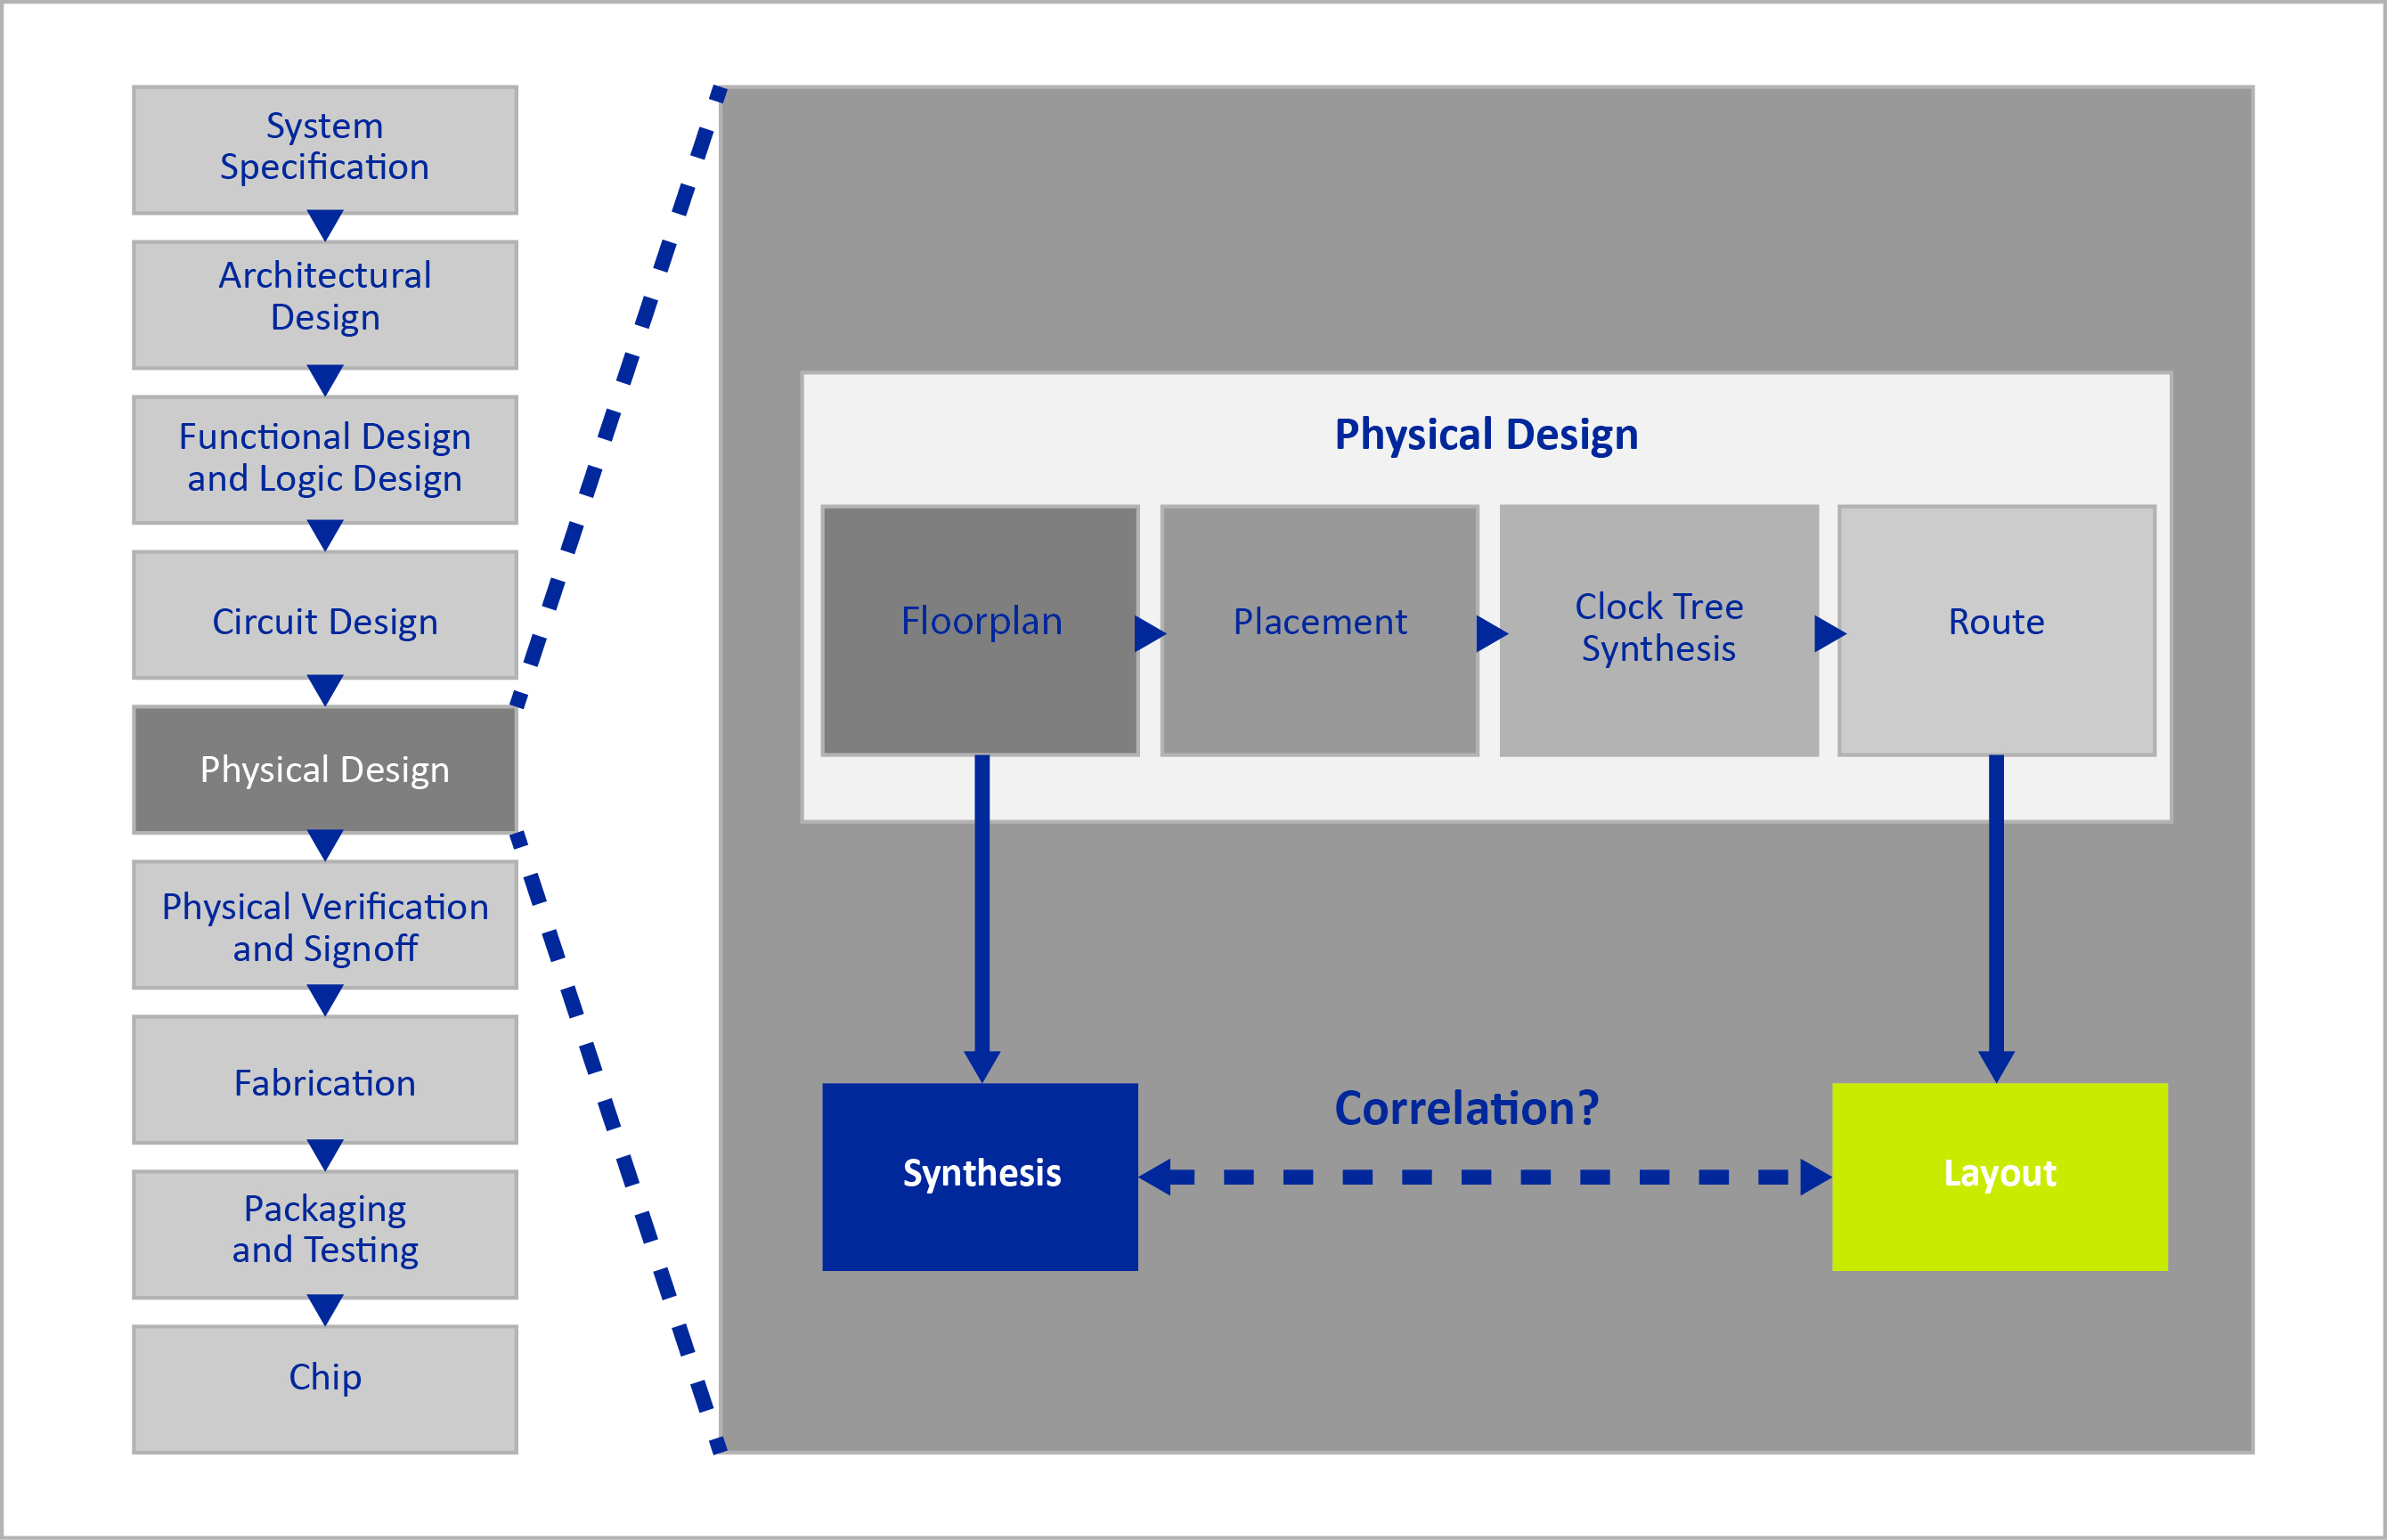
Improving Timing Correlation to Synthesis in Advanced Process Nodes

Voice Isolation: When Noise Reduction Meets Deep Learning

How Computer Vision Empowers Autonomous Drones
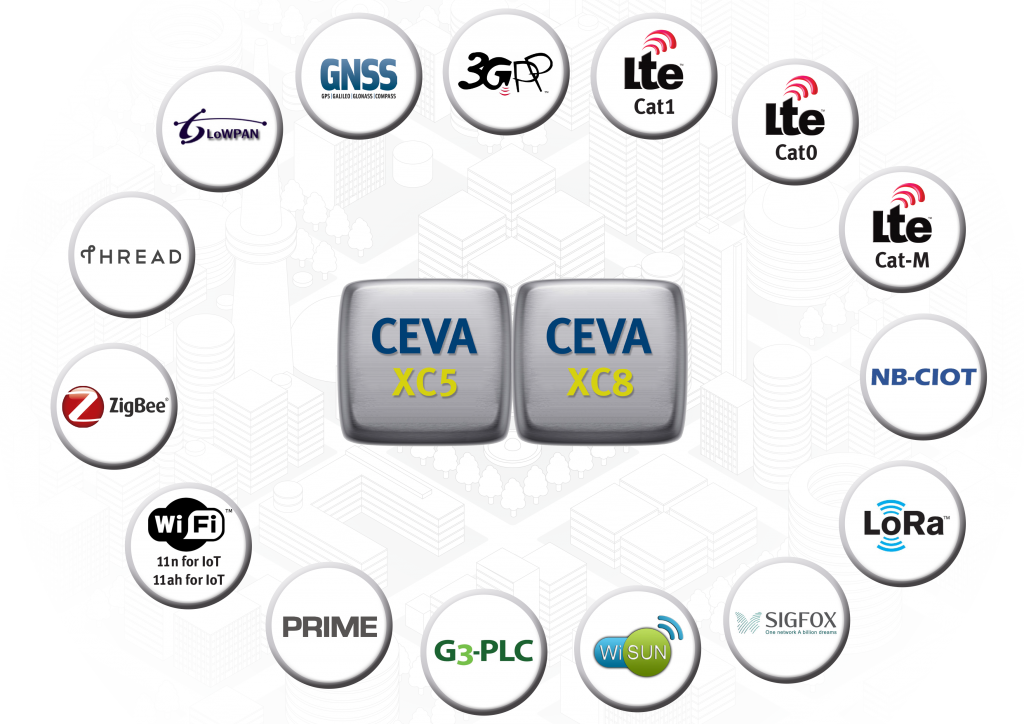
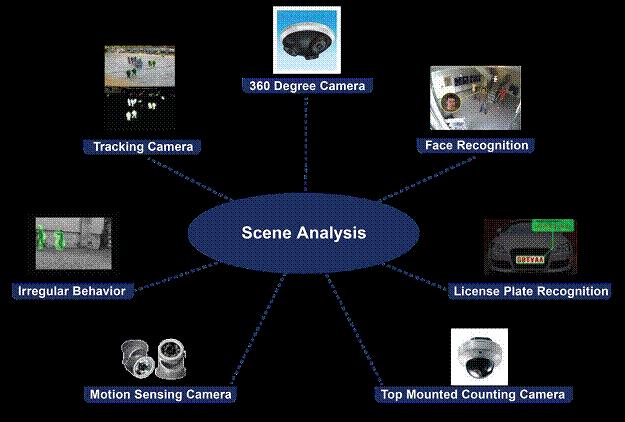
The Case for Local Intelligence in IoT-centric Surveillance Devices

CEVA’s Third Quarter 2015 Earnings – Record All-time Revenues!

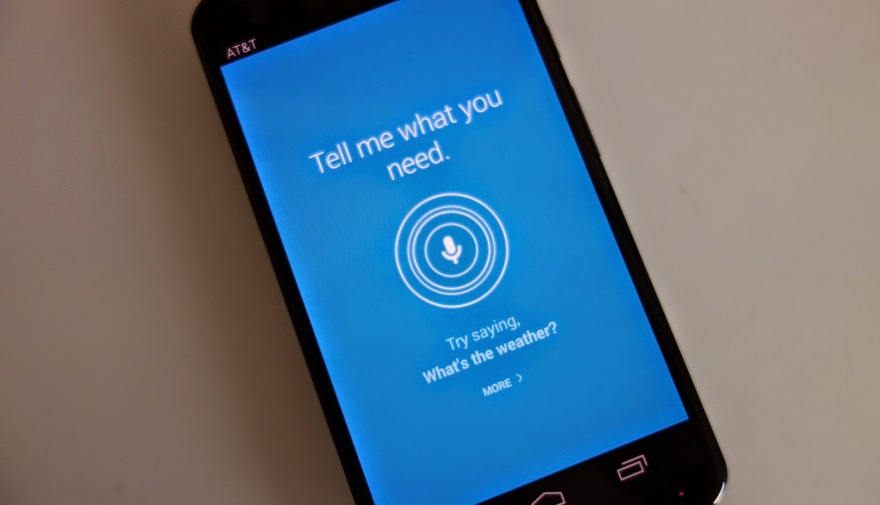
DSPs Favor Always-On, Sensor Fusion in Android Phones

WiFi Three Ways from CEVA

DSP Tunneling Redefines Smartphone Audio

CEVA-Powered Samsung Galaxy Note 5 and S6 Edge+ Announced
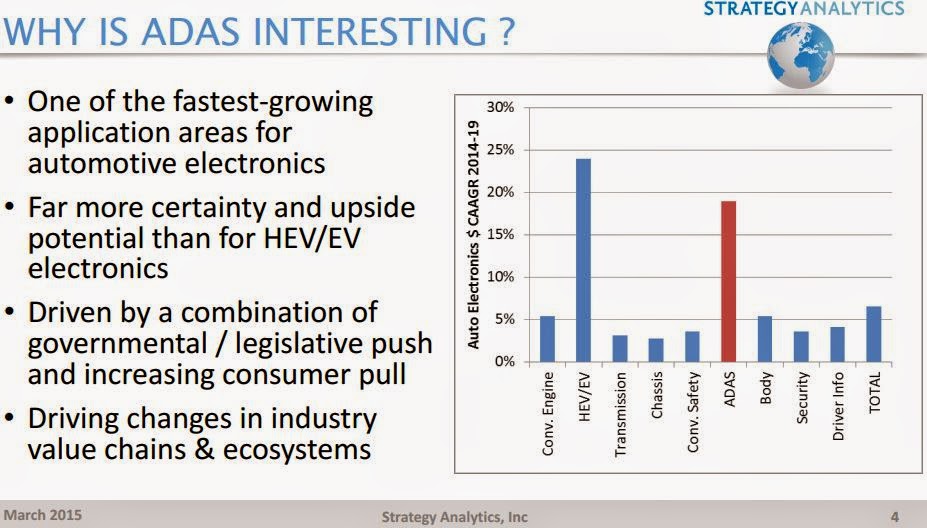
Intelligent Design Challenges for Automotive Engineers
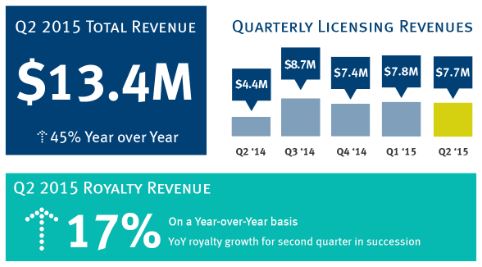
Q2 2015 Earnings – Record Number of Deals Signed
Thoughts About IoT Connectivity
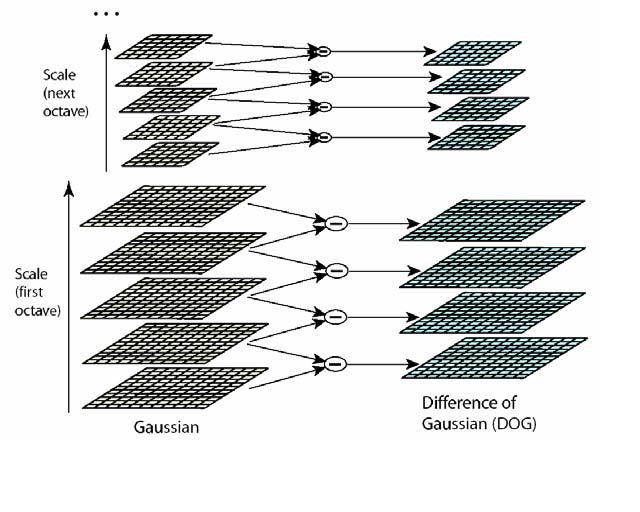
The Evolution of Object Recognition in Embedded Systems
Improving Head Tracking in XR Environments
Get in touch
Reach out to learn how can Ceva help drive your next Smart Edge design


